
Home / Guides / Leverage and liquidation calculator
Leverage and liquidation calculator
Enter your margin, leverage, entry price and the worst move you expect against you. The calculator shows an approximate liquidation price, whether that move would have liquidated the position and the highest leverage that would have survived it.
Last updated:
This is an approximation for a single position in isolated margin. Real exchanges use tiered maintenance margins, fees and their own mark price, so the real liquidation price differs. Check the exact value on your exchange before you trade.
How the calculation works
With isolated margin, the margin of a position is all that can be lost on it. Leverage decides how large the position is compared to that margin. At 5x, $1,000 of margin controls a $5,000 position. A move of 1 % against you then costs $50, which is 5 % of your margin. A move of 20 % against you would cost the whole $1,000.
The exchange does not wait until the margin is completely gone. It closes the position a little earlier, when the remaining margin falls below the maintenance margin. That is why the calculator subtracts the maintenance margin from the distance. The simplified formulas are:
Distance to liquidation = 1 / leverage minus maintenance margin
Liquidation price for a long = entry price times (1 minus distance)
Liquidation price for a short = entry price times (1 plus distance)
Highest leverage for a move = 1 / (move plus maintenance margin)
All percentages are used as fractions in the formula, so 0.5 % becomes 0.005.
A worked example
Take $1,000 of margin, 10x leverage, a long entry at $2,000 and a maintenance margin of 0.5 %. The distance to liquidation is 1 / 10 minus 0.005, which is 0.095 or 9.5 %. The liquidation price is about $2,000 times 0.905, so $1,810.
Now assume the worst move against the trade was 15.64 %. That is far more than 9.5 %, so the position would have been liquidated. The highest leverage that survives a 15.64 % move is 1 / (0.1564 plus 0.005), about 6.2x.
The 15.64 % is not invented. It is the worst move against a single trade in a real ETH scan of M Alpha Core, with 116 trades in one year on the 30 minute chart (ETHUSDT, November 6, 2025 to November 6, 2026). The report of that scan put the leverage limit at 6.39x, because the report ignores the maintenance margin. The small difference comes from the maintenance margin: enter 0 % instead of 0.5 % and the calculator shows 6.39x, which is 100 divided by 15.64. Both numbers say the same thing: above roughly 6x, that one trade would have ended the strategy.
Where the worst move comes from
The most useful input is the worst move against you, and it is also the hardest to guess. Do not use the average move. Use the furthest the price ever went against a single open trade of your strategy, over a long test. Every report of M Alpha Core shows this value for the exact settings of your scan, together with the leverage limit that follows from it. Some examples from our scans:
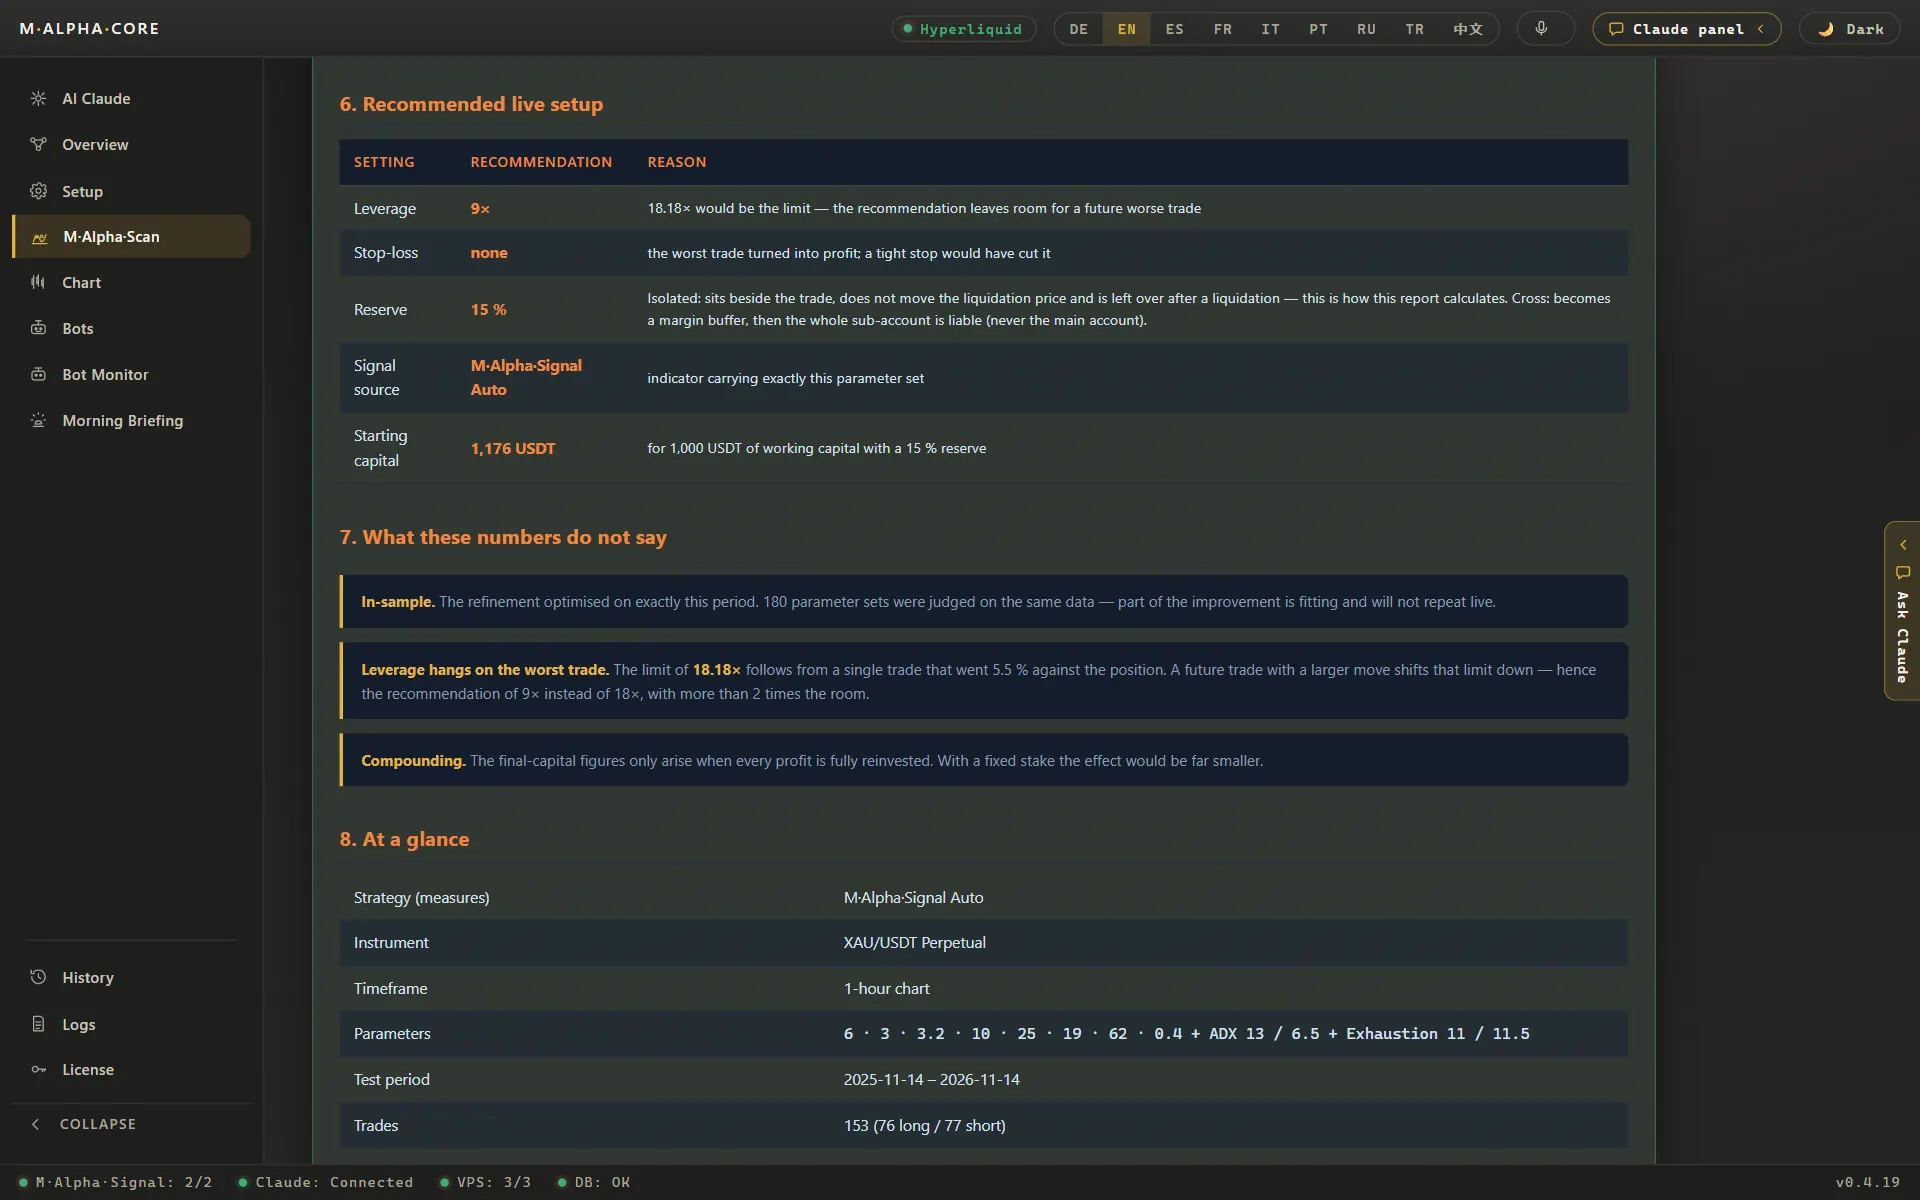
| Gold, 1 hour chart: leverage limit | 18.2x |
| Nvidia: leverage limit | 9.03x |
| ETH example: worst move against a trade | 15.64 % |
| ETH example: leverage limit | 6.39x |
A limit from a backtest is a boundary, not a target. The next bad move can be larger than anything in the test. Most traders stay well below the limit, for example at half of it.
Long and short
For a long position the liquidation price lies below the entry, because a falling price hurts you. For a short it lies above the entry. The distance in percent is the same in this simplified model. In practice the mark price, funding payments and fees shift it a little.
Isolated or cross margin
This calculator assumes isolated margin: each position has its own margin, and only that margin can be lost. In cross margin, a position can draw on the free balance of the whole account. That moves the liquidation price further away, but a single bad position can then eat into money meant for other trades. Money you keep aside to top up a position is called a reserve. M Alpha Core warns you when a position has run half the way to liquidation and again at three quarters, and you can add reserve or close half the position with one tap.
What the calculator does not include
- Tiered maintenance margins that grow with position size.
- Trading fees and the fee charged at liquidation.
- Funding payments while the position is open.
- The difference between the last price and the mark price used by the exchange.
- Gaps, where the price jumps past your liquidation price.
For terms like margin, maintenance margin and funding rate, see the glossary. To see how a full strategy is tested before choosing leverage, read backtest on unseen data.
Frequently asked questions
How is the liquidation price calculated?
In a simplified model for isolated margin: the distance to liquidation is 1 divided by the leverage minus the maintenance margin. For a long, the liquidation price is the entry price times 1 minus that distance.
Is the result exact?
No. It is an approximation. Exchanges use tiered maintenance margins, fees and a mark price, so the real value differs.
What maintenance margin should I enter?
The value your exchange shows for the market and position size. 0.5 % is a common starting value for large markets, but check your exchange.
What is the highest leverage for a 10 % move?
With a maintenance margin of 0.5 %, about 1 divided by 0.105, so roughly 9.5x. Any move larger than 10 % would then liquidate the position.
Why does higher leverage bring liquidation closer?
Because the same price move costs a larger share of your margin. At 10x, a 10 % move costs the whole margin.
Does the calculator work for short positions?
Yes. Choose short, and the liquidation price is calculated above the entry price.
Where do I find the worst move of my strategy?
In a backtest. Every M Alpha Core report shows the worst move against a single trade and the leverage limit that follows from it.
Is any leverage safe?
No. Even without leverage you can lose money. Leverage only changes how fast and how completely a loss can happen.
Related pages
All figures come from backtests on past market data. No result is a promise of future profit. Trading, especially with leverage, involves high risk. M Alpha Core is a software tool, not investment advice.