
Home / Guides / How to backtest a trading strategy
How to backtest a trading strategy
A backtest shows how a set of rules would have traded in the past. Done well, it saves you money and time. Done badly, it gives you false confidence. This guide walks through a backtest step by step, with real numbers from our own scans.
Last updated:
What a backtest is
A backtest takes a strategy with clear rules and runs it over historical prices, candle by candle. Every time the rules say enter, the test opens a trade. Every time they say exit, it closes it. At the end you have a list of trades and a set of numbers that describe them.
The key word is clear rules. "Buy when it looks strong" cannot be tested. "Buy when the close is above the highest high of the last 20 candles" can. If a rule needs your judgment, the backtest tests your judgment on a day you already know the answer, and that is worthless.
Step 1: Write down the rules
Every rule must be precise enough that two people would place the same trades. Write down:
- the market and the time frame, for example gold on the 1 hour chart,
- when to enter long and when to enter short,
- when to exit, both with a profit and with a loss,
- how large each position is,
- which leverage is used, if any.
Fewer rules and fewer settings are better. Each extra setting gives the search one more way to fit noise. M Alpha Core uses one built in strategy, M Alpha Signal, and its scan finds the best settings of that built in strategy for your market. That keeps the number of moving parts small. The methodology page describes the scan in detail.
Step 2: Get clean data
Use data from the market you will really trade, on the time frame you will really trade. If your bot trades a perpetual contract on an exchange, the price of that contract is the best source. Use at least one year, so the data holds rising, falling and sideways phases. One year on the 1 hour chart already holds several thousand candles.
Check the data for gaps and obvious errors. A single wrong candle with a price spike can create a fake winning trade that does not exist in reality.
Step 3: Include costs
Every real trade costs money. A backtest without costs is too optimistic, and the more trades a strategy makes, the larger the error.
- Fees. Exchanges charge maker and taker fees on every order.
- Slippage. A market order fills at the next available price, which may be worse than the price you saw.
- Funding. Perpetual contracts charge or pay funding at regular intervals while a position is open.
A strategy that only survives without costs does not survive.
Step 4: Split the data before you search
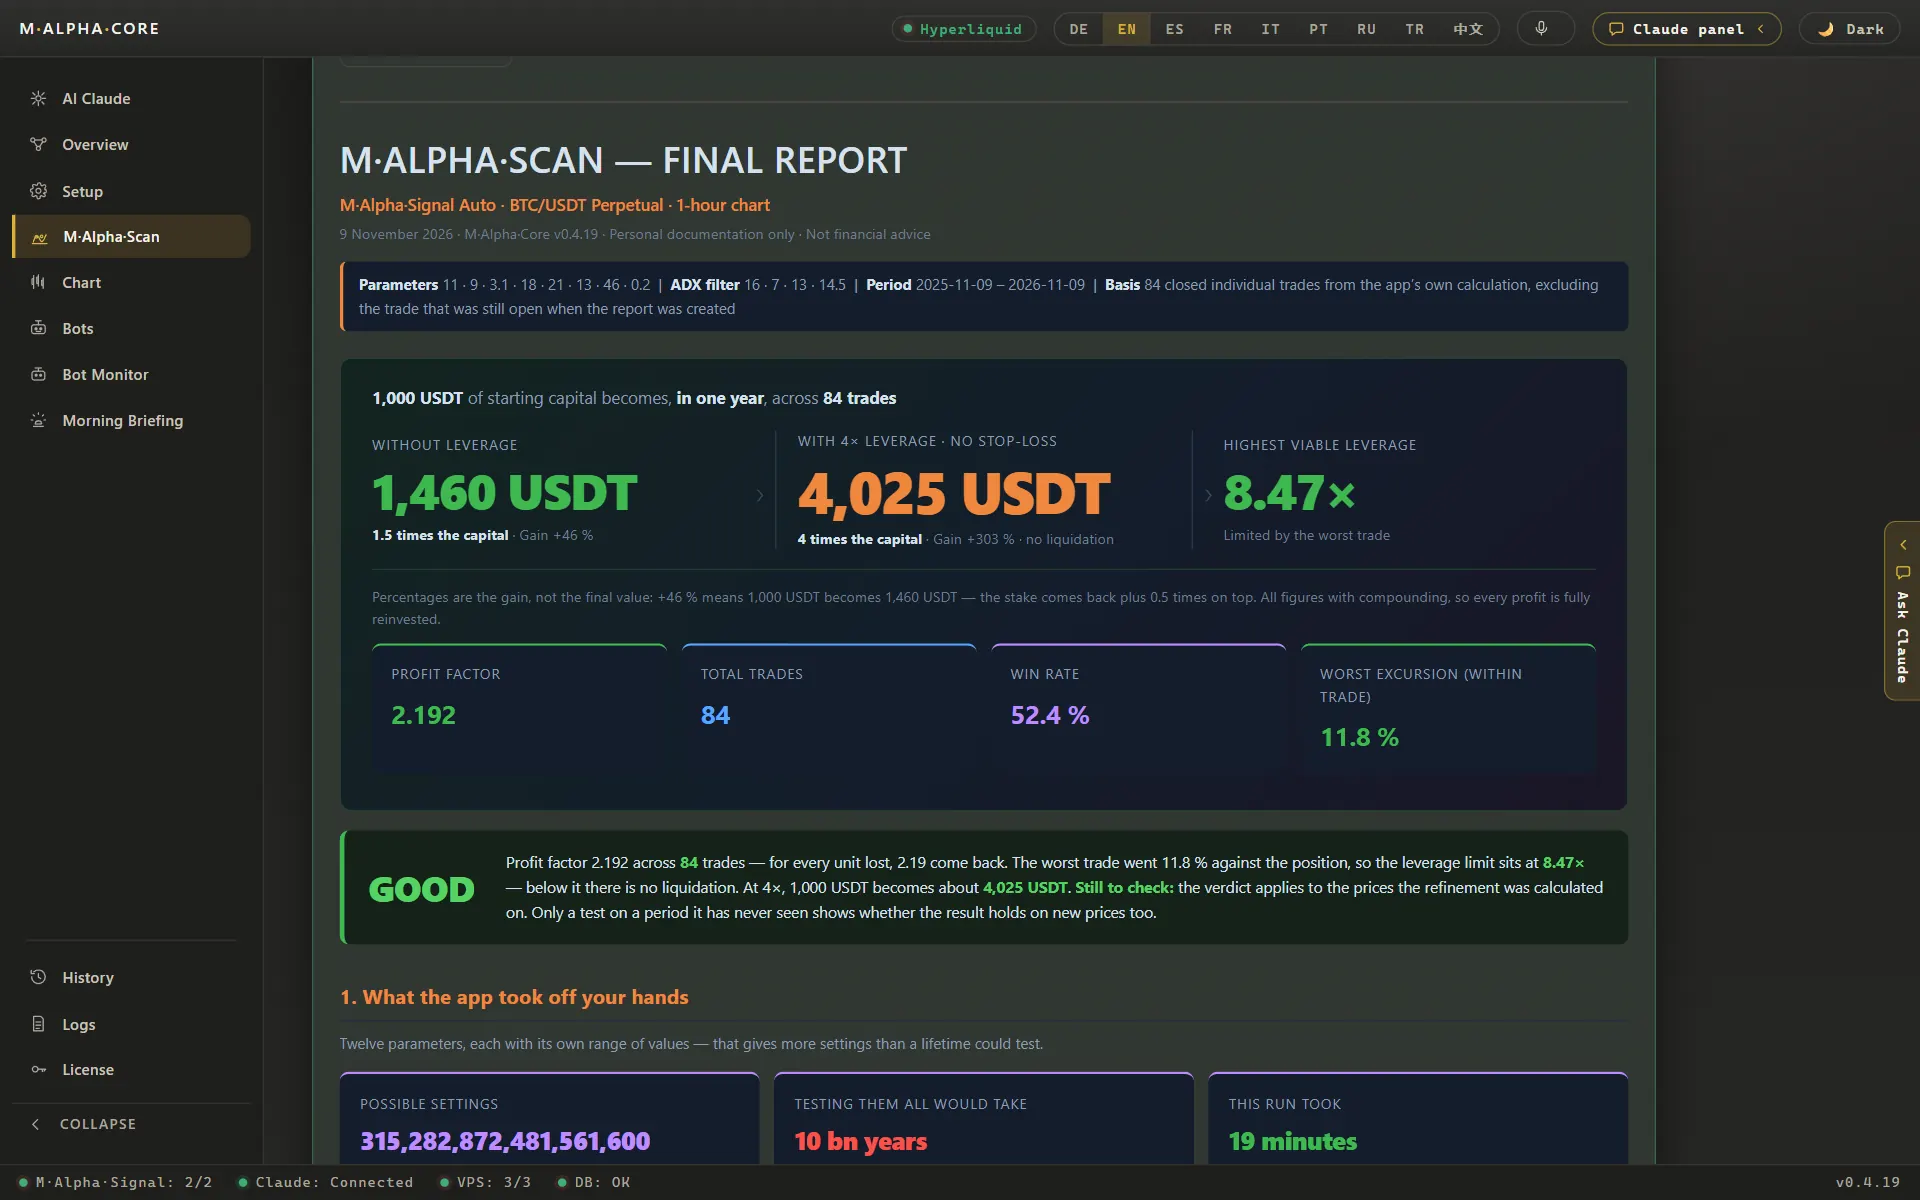
This is the step most backtests skip. If you will try more than one setting, split the data in time order before you start. The first part is for the search. The second part is locked away until the search is finished.
M Alpha Core searches on the first 65 % of the year and keeps the last 35 % aside. The settings found on the first part are then run once on the second part, without any change. The report shows both parts side by side. The guide to out of sample testing explains why this order matters and what walk forward testing adds.
Step 5: Run the test and the search
Now run the strategy. If you test by hand, you go through the chart and note every trade. That works for one setting and a few months. For thousands of settings over a full year you need software. The M Alpha Core scan server tests thousands of settings per scan and keeps the best ones for the check on unseen data.
Step 6: Read the numbers
A report has many numbers. These matter most:
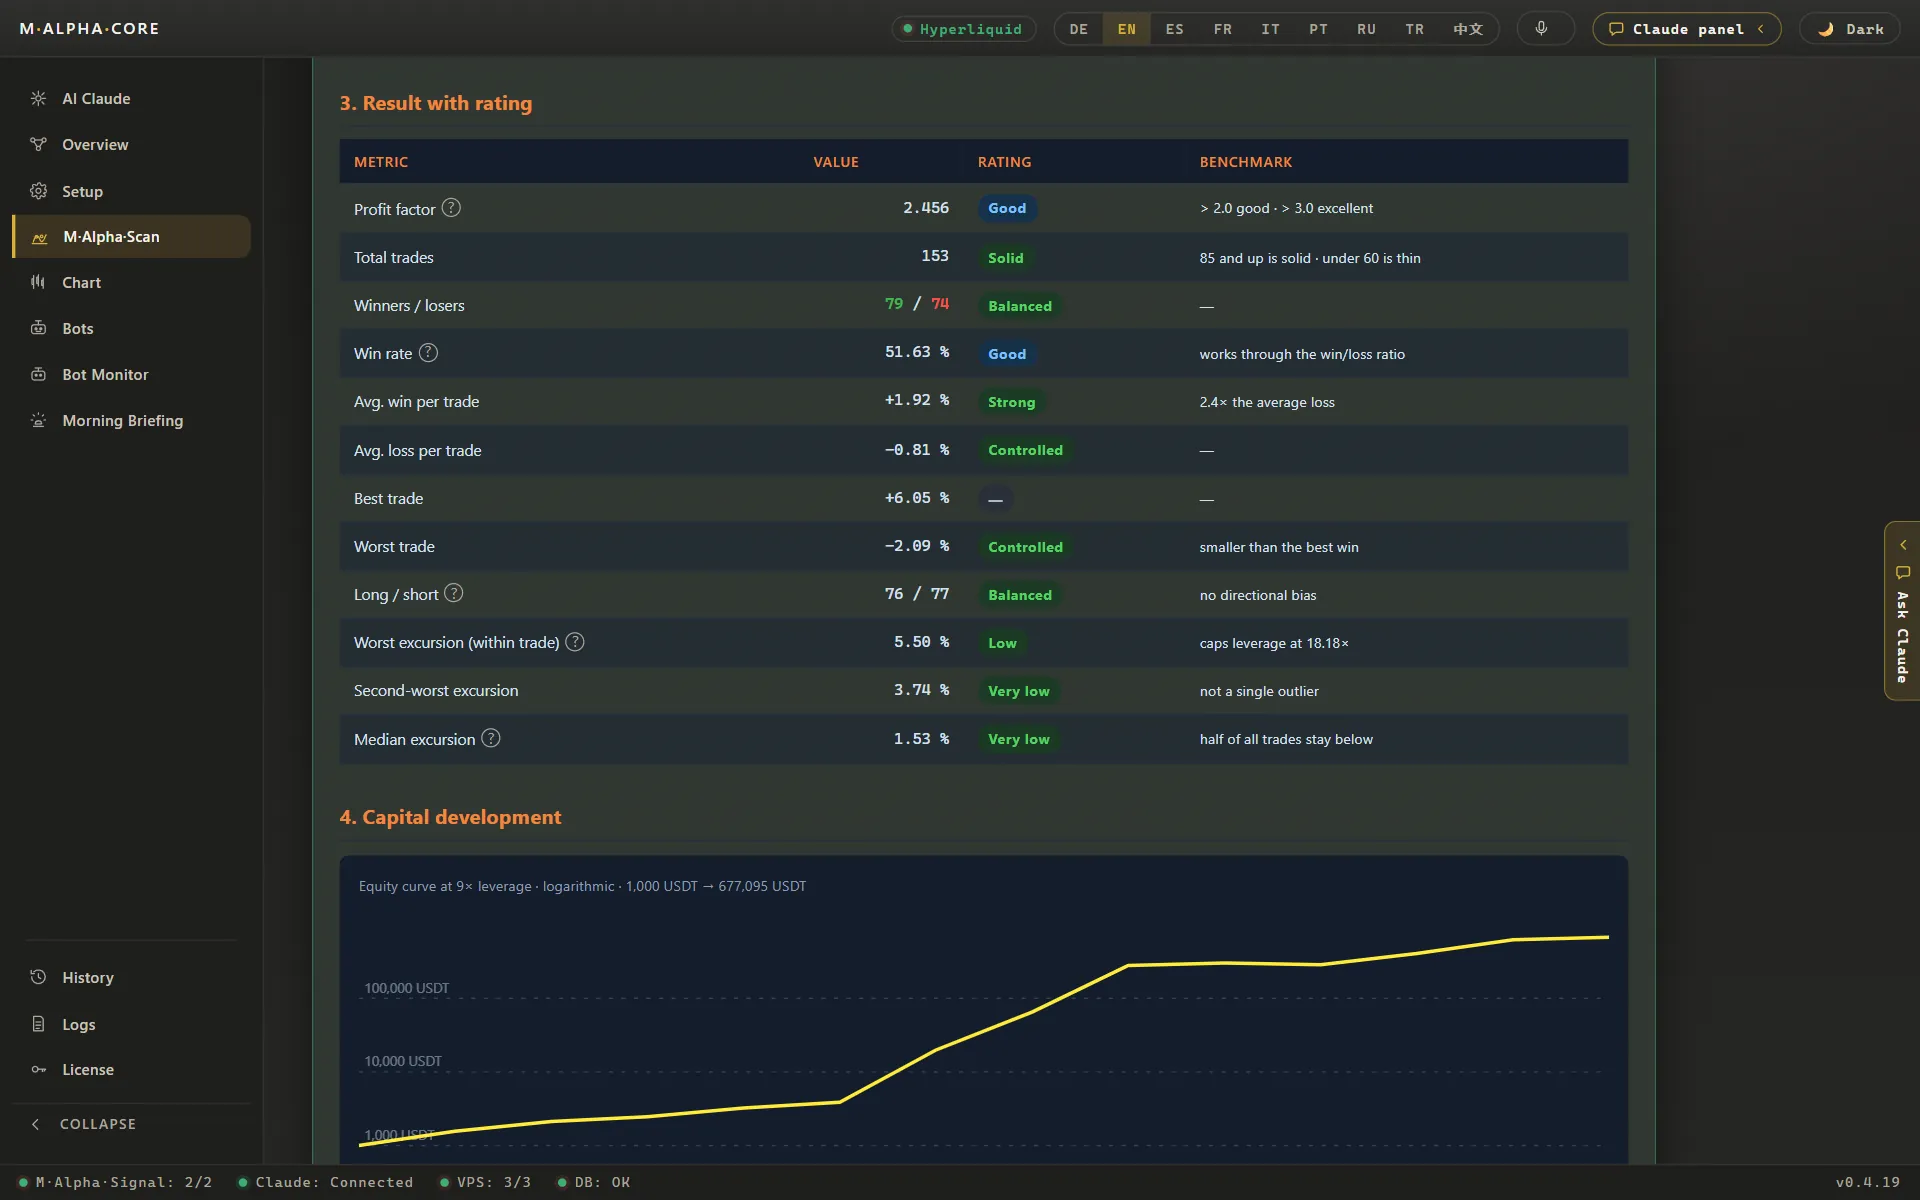
| Number of trades | Enough to mean something. Gold: 153, Nasdaq 100: 101, Nvidia: 89, ETH: 116 |
| Profit factor | Dollars won per dollar lost. Gold: 2.53 searched, 2.81 unseen |
| Win rate | Share of winning trades. ETH: 58.6 % of 116 |
| Worst move against a trade | ETH: 15.64 % |
| Leverage limit | Gold 18.2x, Nvidia 9.03x, ETH 6.39x |
| Result without leverage | Gold: $1,000 became $2,446 |
All values from our own scans. Profit factor and win rate are explained in the glossary.
Profit factor
The profit factor divides the sum of all winning trades by the sum of all losing trades. A value of 2.53 means 2.53 dollars won for every dollar lost. Below 1 the strategy lost money. It is a better summary than the win rate, because it weighs how large wins and losses were.
Win rate
The share of trades that closed with a profit. A high win rate feels good, but on its own it says little. A strategy can win 90 % of its trades and still lose money if the few losers are large.
Drawdown
The largest drop of the account from a high point to a later low point. It tells you how painful the worst phase was. Ask yourself honestly whether you would have kept the bot running through it.
Worst move and leverage limit
The worst move against a single trade is the furthest the price went against an open position before it closed. With leverage this move decides whether a position survives. From it follows the highest leverage the trade would have survived. You can test this with the leverage and liquidation calculator.
Step 7: Compare searched and unseen data
Now take out the second part. Run the chosen settings on it and compare. If the profit factor holds up, as in the gold example where it went from 2.53 to 2.81, the settings did not depend on the exact months of the search. If it falls far, the search fitted noise. Do not tune the settings again on the unseen part. Once you do, it is no longer unseen.
Step 8: Look at every trade
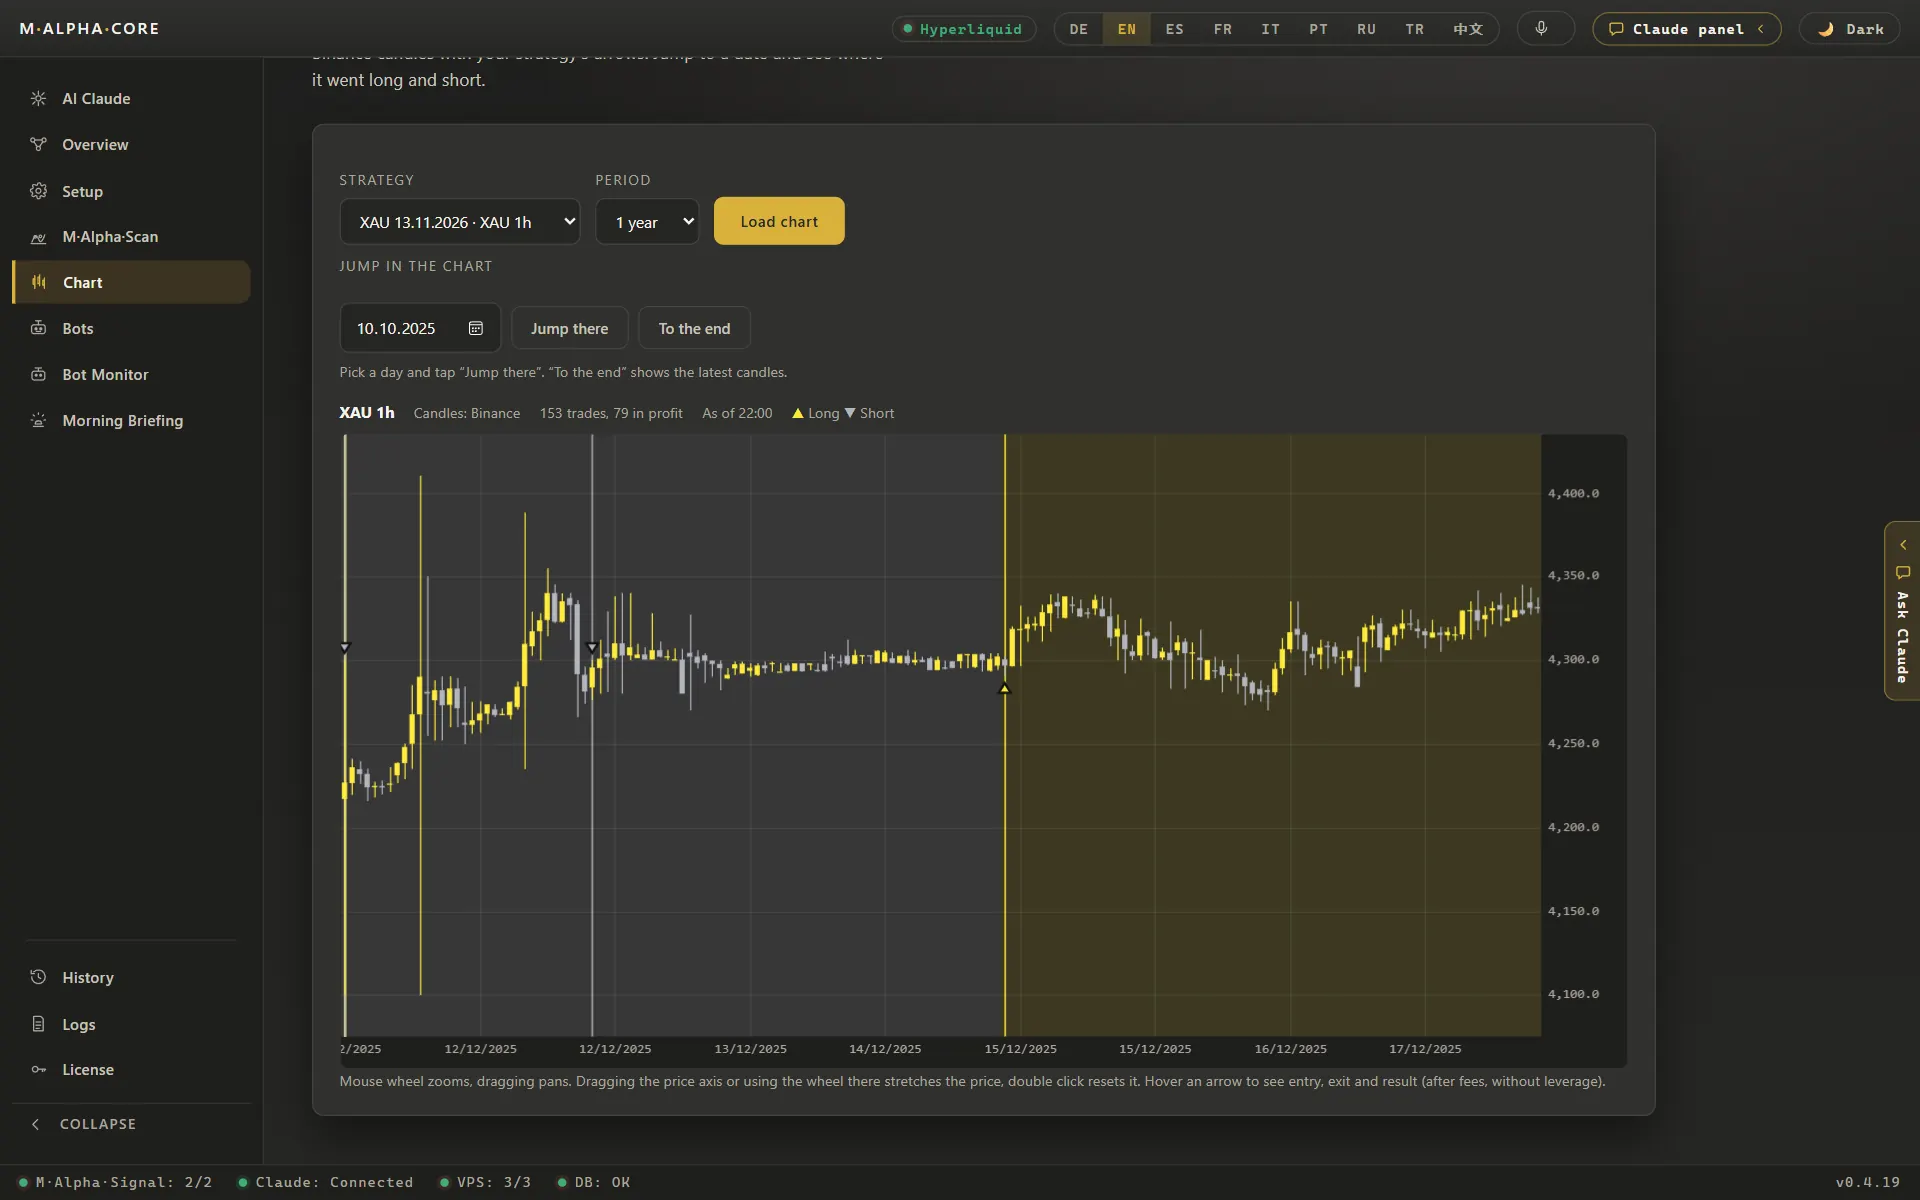
Open the chart with all trades marked. Look for clusters: did most of the profit come from one week? Look at the losers: are they small and similar, or are there a few large ones? Look at the quiet phases: how long did the strategy go without a new high? A table cannot show you these things, the chart can.
Step 9: Forward test before real money
The last step is a test on live prices without real orders, often called a dry run or paper trading. It checks the parts a backtest cannot: the connection to the exchange, the timing of signals, the behaviour in the current market. In M Alpha Core every bot starts this way and reports each step to Telegram before you switch it to live.
Common backtesting mistakes
- Look ahead bias. The test uses information that was not available at the time, for example the close of a candle to enter at its open.
- Too many settings. The more knobs, the easier it is to fit the past perfectly and the future badly.
- No costs. Fees, slippage and funding left out.
- Too little data. A few weeks or a single trend phase.
- Testing on the unseen part again and again. Each new look turns it into search data.
- Ignoring the worst trade. A great profit factor with a leverage that one move would have wiped out.
- Survivor thinking. Testing only markets that did well, because those are the ones you remember.
By hand, own script or software
You can backtest by hand with a chart and a spreadsheet. It teaches you a lot and is fine for one setting. An own script is flexible, but you have to write, check and maintain it, and the split, costs and leverage math are your job. A tool like M Alpha Core does the search, the 65/35 check, the leverage limit and the chart for you, and then runs the same settings as your own bot.
| What matters | By hand | Own script | M Alpha Core |
|---|---|---|---|
| Testing many settings | Slow, a few settings per evening | Possible, if you write and maintain the code | Thousands of settings per scan on our scan server |
| Test on unseen data | Rarely done | Only if you build the split yourself | In every report: search on 65 %, test on the last 35 % |
| Leverage risk in numbers | Guesswork | Only if you calculate it | Worst move inside a trade and the leverage that would have survived it |
| Trading around the clock | Only while you watch the screen | Needs your own server and monitoring | Your bot on your own server, checked every minute by a watchdog |
| Programming needed | No | Yes | No, you tap through the app |
| Who holds the exchange key | You | You | You, in the vault of your device and on your own server |
| Cost | Your time | Your time plus a server | From $49 a month plus a small server for about $12 a month |
If you are weighing M Alpha Core against other bot tools, our side by side pages cover M Alpha Core vs 3Commas, M Alpha Core vs Pionex, M Alpha Core vs Cryptohopper and M Alpha Core vs Gainium.
Frequently asked questions
What is backtesting in trading?
Running a strategy with clear rules over past prices and recording every trade it would have made, to see how it would have performed.
How much data do I need for a backtest?
At least one year on the time frame you will trade, so the test includes rising, falling and sideways phases.
What is a good profit factor?
Above 1 means profit in the test period. More important than the exact value is that it holds up on data the search never saw.
Why is win rate not enough?
A high win rate can hide a few large losses. The profit factor weighs the size of wins and losses.
What is look ahead bias?
Using information in the test that was not available at the time of the trade, which makes results look better than they could be.
Should fees be part of a backtest?
Yes. Fees, slippage and funding reduce every result, and a strategy that trades often can lose its whole edge to them.
What is the difference between a backtest and a forward test?
A backtest uses past prices. A forward test, or dry run, uses live prices without sending real orders.
Can I backtest without coding?
Yes, by hand on a chart for a few settings, or with M Alpha Core, which runs the scan and the check on unseen data in the app.
How does M Alpha Core split the data?
It searches on the first 65 % of the year and tests the chosen settings on the last 35 %, which the search never saw.
Does a good backtest guarantee profit?
No. It shows how the rules would have performed in the past. Markets change.
Compare M Alpha Core
Side by side with other bot tools, with sources for every statement about them.
Exchanges in M Alpha Core: Binance · Bybit · Bitget · OKX · MEXC · Gate · BingX · KuCoin · Crypto.com · Hyperliquid
Related pages
All figures come from backtests on past market data. No result is a promise of future profit. Trading, especially with leverage, involves high risk. M Alpha Core is a software tool, not investment advice.