
Home / Guides / Backtest on unseen data
A backtest on data the search never saw
Almost any strategy looks great on the data it was tuned on. The real question is how it does on data it has never seen. That is what M Alpha Core shows in every report.
Last updated:
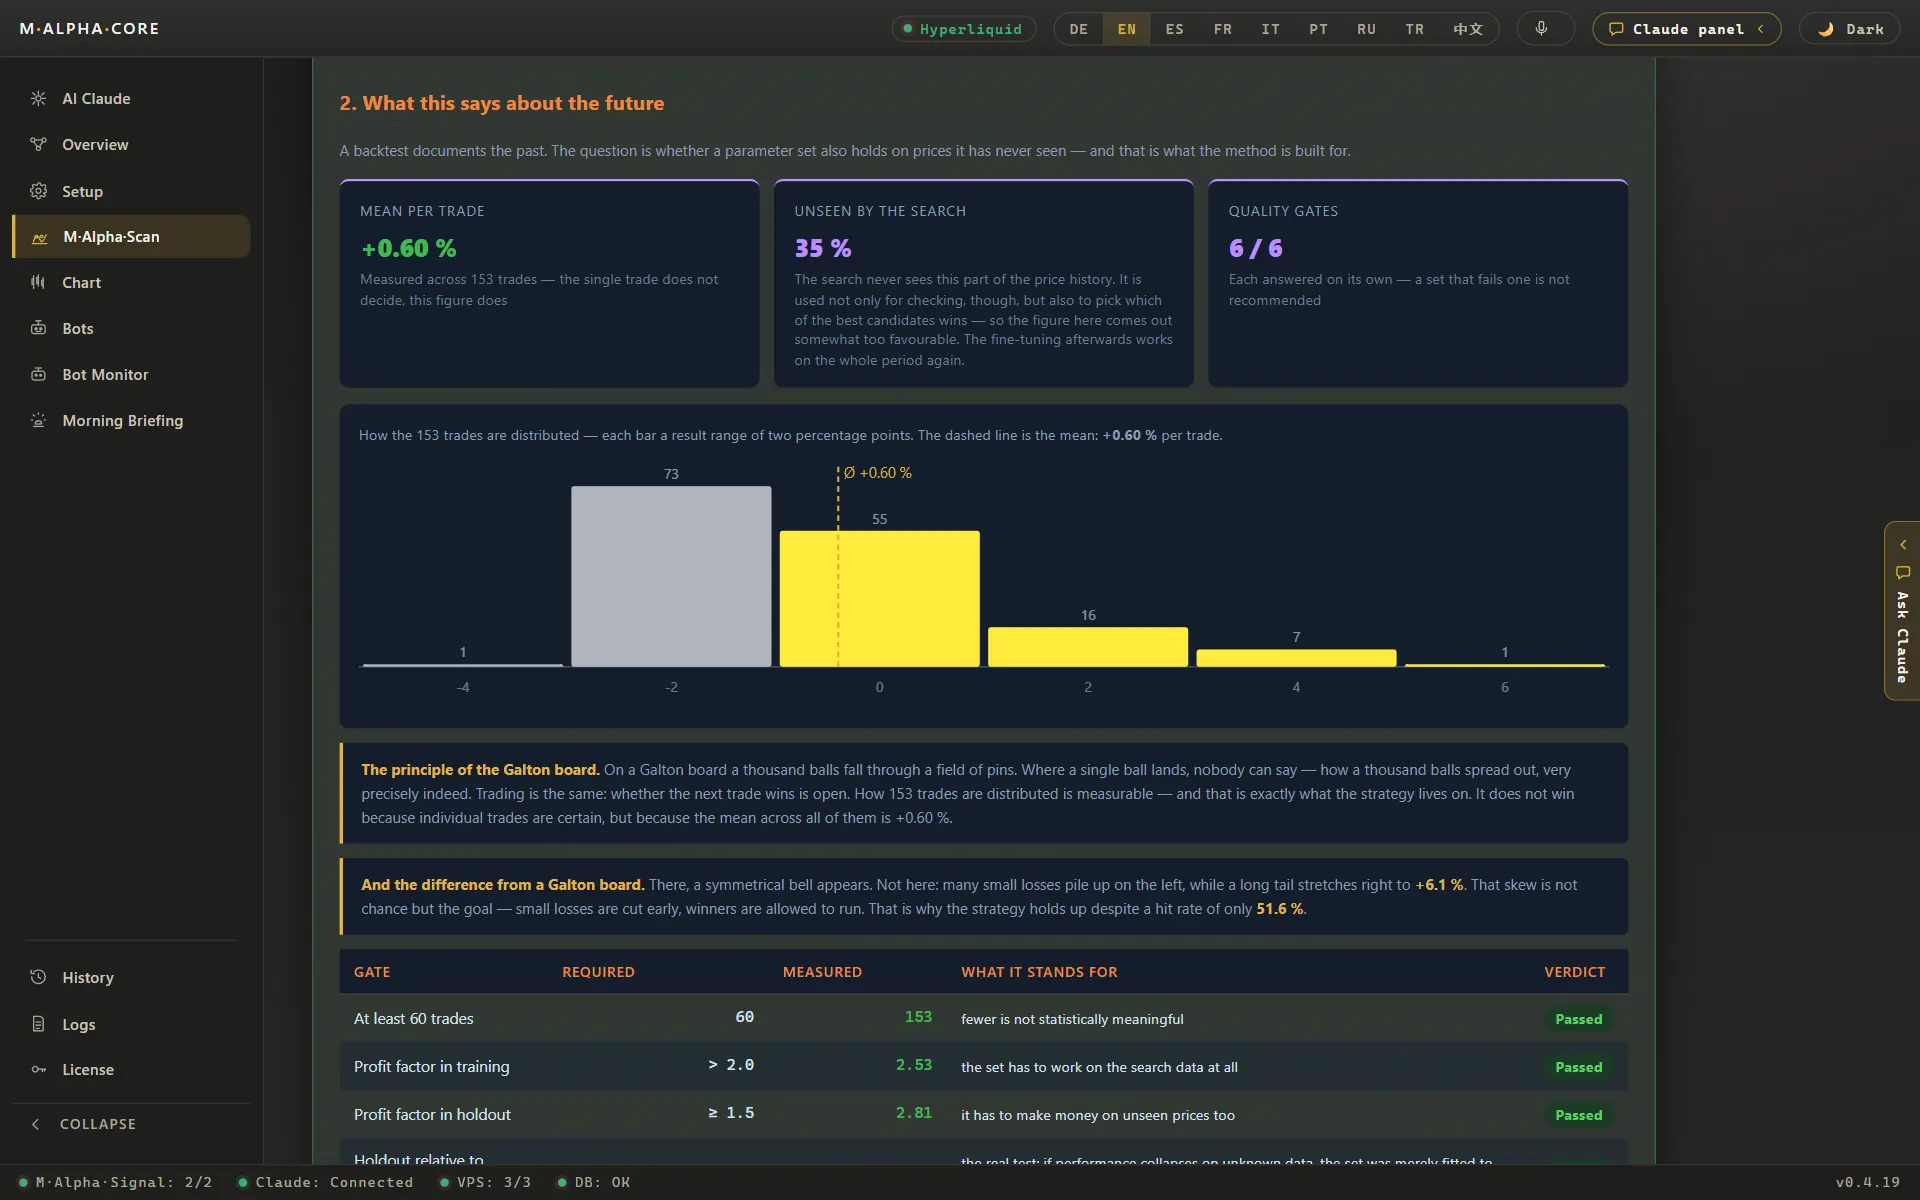
Example: gold, 1 hour chart
| Search on the first | 65 % of the data |
| Test on the last | 35 %, never seen by the search |
| Trades in the test period | 153 |
| Profit factor on searched data | 2.53 |
| Profit factor on unseen data | 2.81 |
| Nvidia: profit factor searched / unseen | 2.19 / 4.90 |
| Nasdaq 100: profit factor on unseen data | 2.17 |
| ETH example: worst move against a trade | 15.64 % |
| ETH example: leverage limit | 6.39x |
If the profit factor on unseen data drops far below the searched part, the settings were probably fitted to noise. If it holds up, the settings found something that also worked outside the data they were chosen on.
Why normal backtests lie
A backtest runs a set of rules over past prices and shows what would have happened. That sounds objective, and for one fixed set of rules it is. The trouble starts when you search. As soon as you try many settings and keep the best one, the best one is partly the luckiest one. With thousands of settings, some will look perfect in hindsight just by chance, even on random prices.
This is called overfitting. The settings describe the noise of the past instead of a pattern that repeats. An overfitted strategy shows a beautiful curve on the screen and then fails once real money is involved. The more settings a search tries, the larger this risk. A tool that tests thousands of settings, as M Alpha Core does, must therefore check its own result on fresh data. Otherwise the search is a machine for producing pretty, useless curves.
The 65/35 split
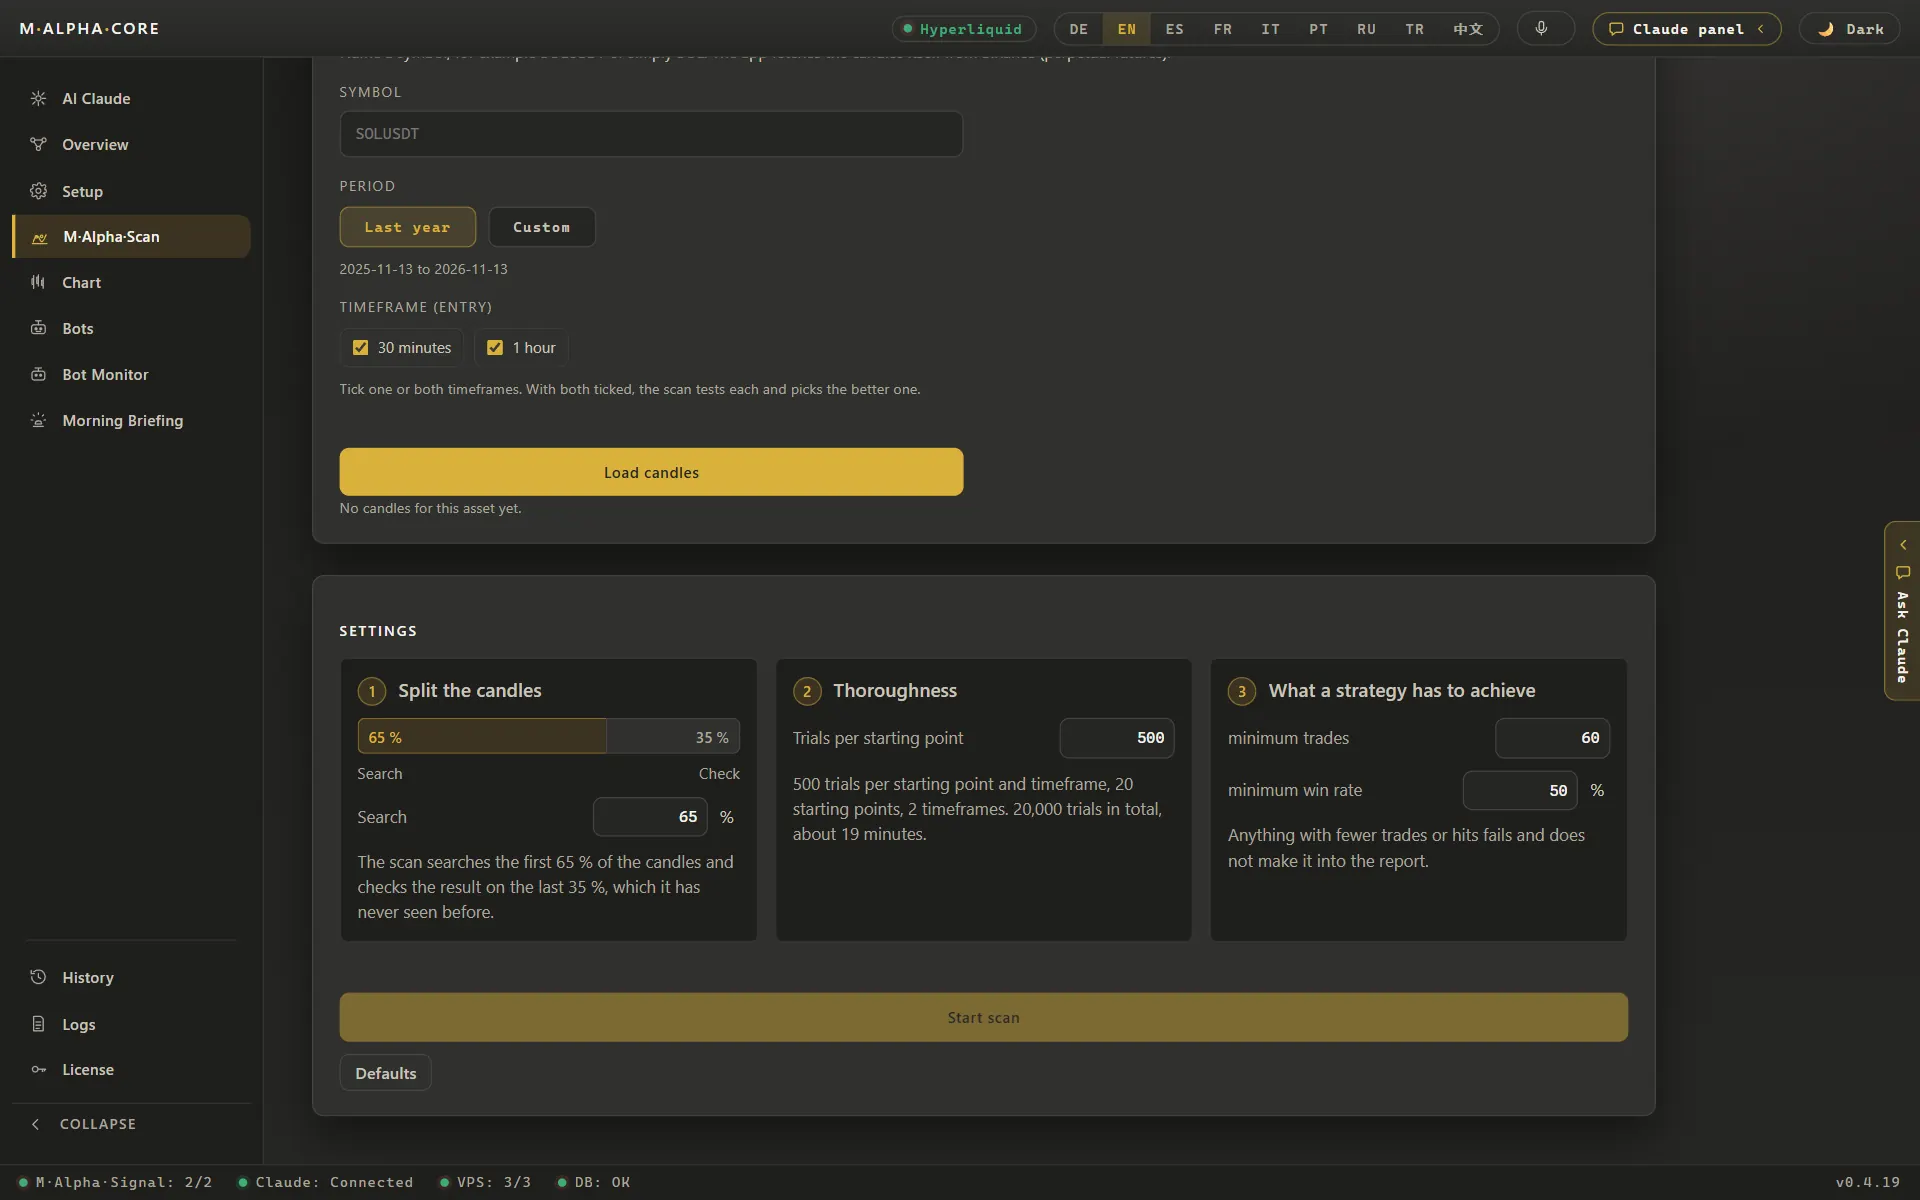
M Alpha Core splits every test period in two parts. The first 65 % is the search part. Here the scan tests thousands of settings and picks the best ones. The last 35 % is the unseen part. The search never looks at it. Once the settings are fixed, they run on this part without a single change, and the report shows the result next to the search result.
The split is in time order. The unseen part always comes after the search part, just like the future comes after the past. Mixing the order, for example by testing on random months, would let information from the future leak into the search and make the result look better than it is.
How to read the two numbers
The key figure is the profit factor: dollars won for every dollar lost. Above 1 a strategy made money in that period, below 1 it lost. Compare the searched part with the unseen part.
- Unseen holds up or rises. In the gold example the profit factor went from 2.53 to 2.81. The settings did not depend on the exact months they were found on. This is what you want to see.
- Unseen much higher. Nvidia went from 2.19 to 4.90. That is a pass, but not a reason for joy. The unseen part is shorter and holds fewer trades, so a few lucky trades weigh more.
- Unseen falls far. If a profit factor of 2.5 drops to 1.1 on the unseen part, the search most likely fitted noise. Do not trade these settings, however good the first part looks.
- Too few trades. A profit factor from a handful of trades says little. The gold example had 153 trades in its test period, Nvidia 89, the Nasdaq 100 101, the ETH example 116.
Risk in plain numbers
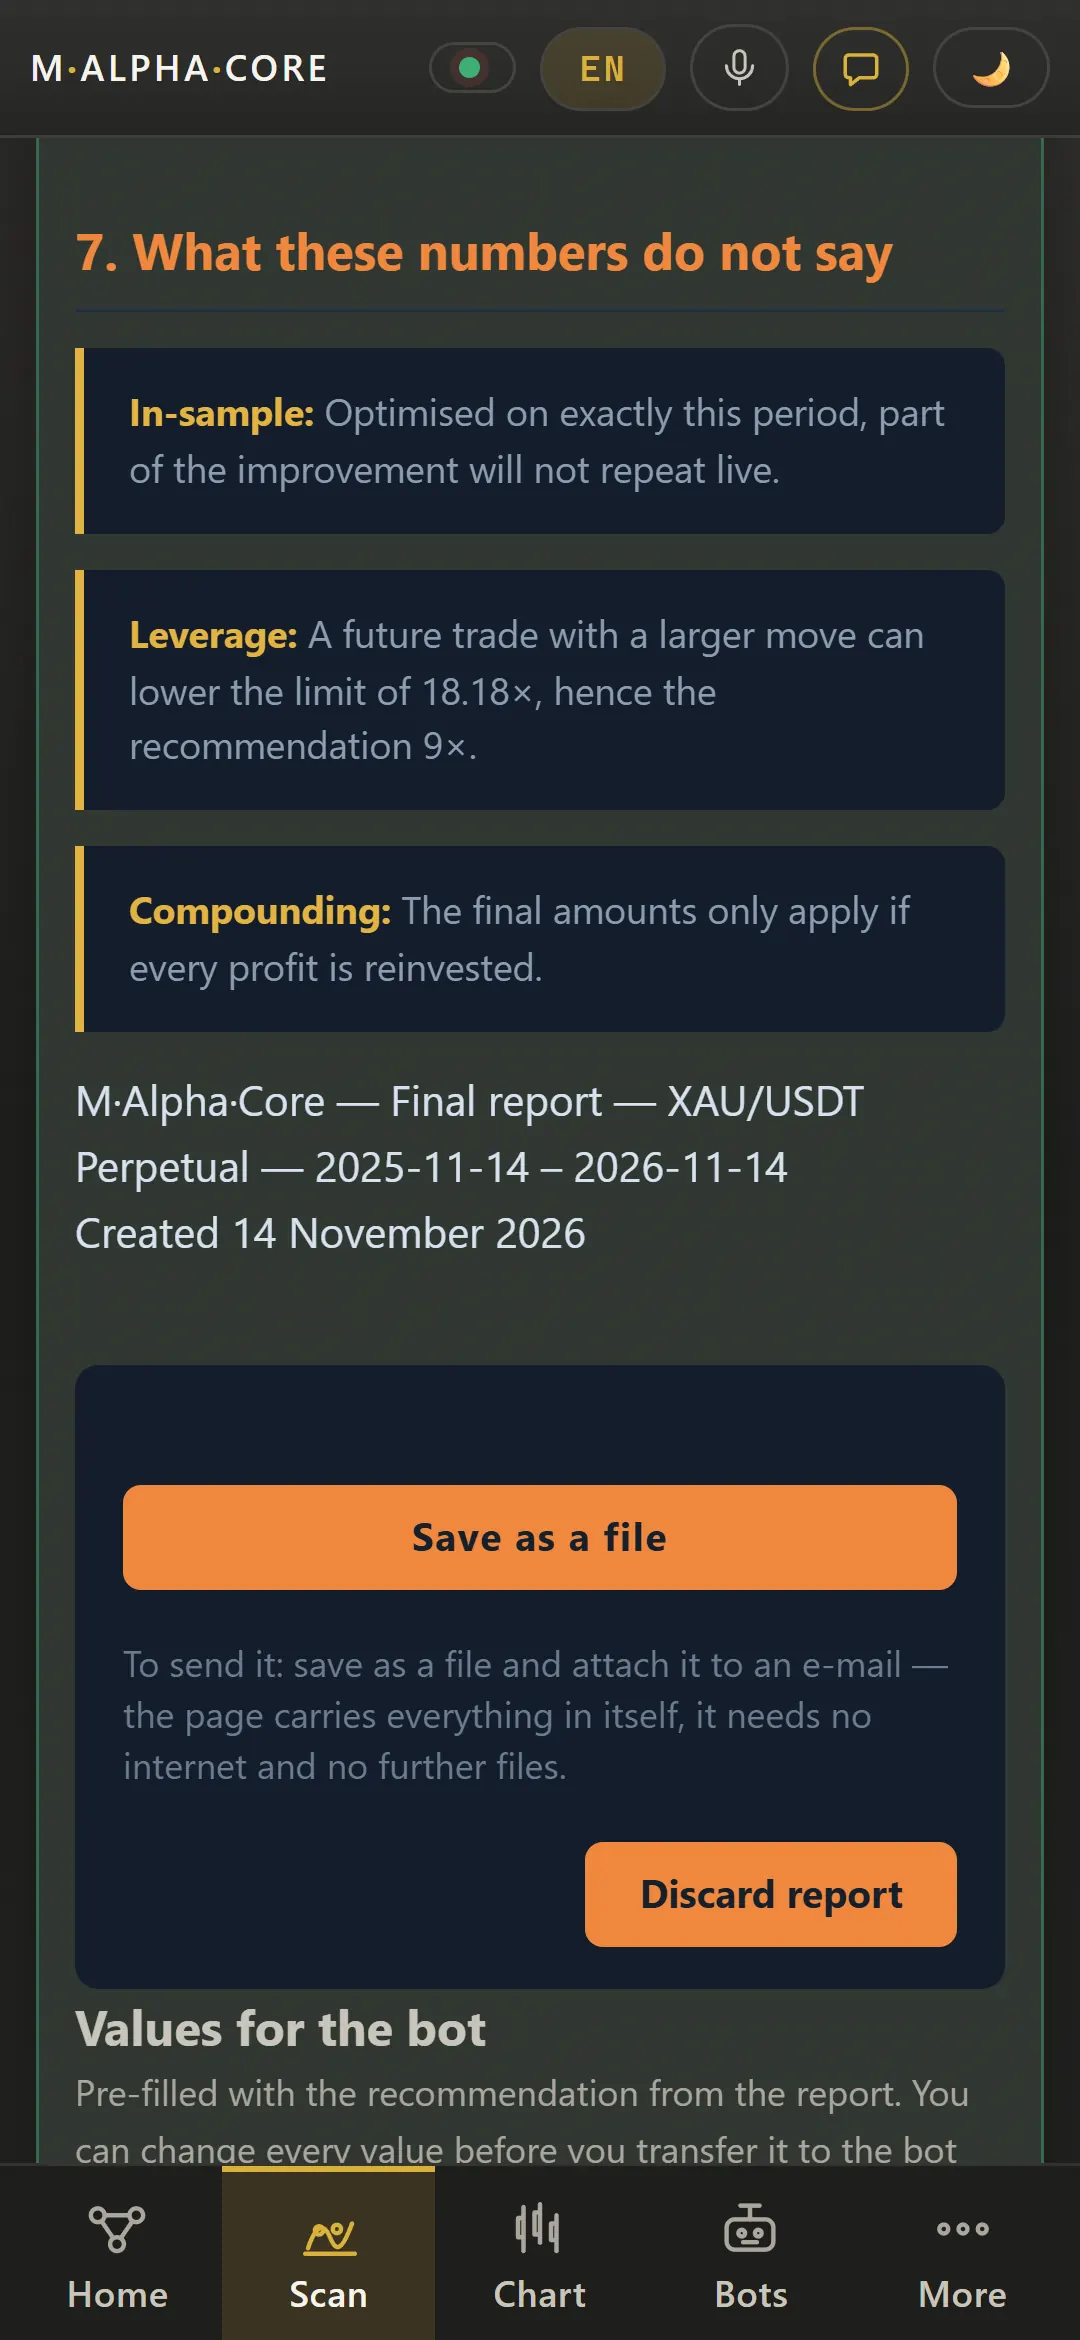
A good profit factor alone can still hide a dangerous trade. The report therefore shows how far the price ever moved against you inside a single trade. In one ETH strategy that was 15.64 %. With leverage, a move of that size against you can wipe out the margin of the position. From the worst move the report calculates the highest leverage the trade would have survived: 6.39x in that ETH example, 18.2x for gold and 9.03x for Nvidia.
That limit is not a recommendation to go all the way. The next bad move can be larger. It is a hard boundary that tells you where the backtest itself would already have failed. You can test this relation for any move with the leverage and liquidation calculator.
Every trade, also the losers
A number can hide a lot. That is why the report also shows every single trade of the test on the chart, the winners and the losers. You see where the strategy entered and left, how long trades lasted and what the bad phases looked like. If the unseen part only made money in one wild week, you see that at once.
From test to bot, step by step
- Install the app. M Alpha Core runs on Windows 10 and 11, on macOS 11 or newer (Apple Silicon and Intel) and on Android 10 or newer. Get it on the download page. One Standard license covers one computer and one phone, Pro covers three devices in any mix.
- Scan your market. Type the symbol of a coin, of gold or of a stock in the scan screen. Pick a time frame and a date range, then start the scan. It runs on our scan server, so you can close the app or put your phone away while it works.
- Read the report. Look at the number of trades, the profit factor on the searched part and on the unseen part, the result with and without leverage, the worst move against a single trade and the leverage that move would have allowed. Open the chart and look at every trade, the losers included. The methodology page explains how each figure is calculated.
- Rent a small server and start your bot. The app walks you through renting a small server for about $12 a month and sets it up for you. Your bot first runs as a dry run: it only writes down what it would do and sends every step to your Telegram.
- Connect your exchange with a trading only key. Create an API key on one of the ten supported exchanges. Create an API key that may trade but may not withdraw. The key is stored in the protected vault of your device and on your own server. Our scan server never sees it. The security page explains how keys, servers and the control panel are protected.
- Go live when you are ready. A practice bot stays a practice bot, so for real money you set the bot up once more without the dry run tick. From then on it trades on your own account, and you can set it to long, short, reverse or stop with one tap in the app or in the control panel in your browser.
The bot then runs with exactly the settings that passed the unseen test. Nothing is tuned again in between. If you later want new settings, you run a new scan with a fresh split.
By hand, own script or M Alpha Core
You can do an out of sample test by hand or with your own code. The question is how much work it is and whether you really do it every time.
| What matters | By hand | Own script | M Alpha Core |
|---|---|---|---|
| Testing many settings | Slow, a few settings per evening | Possible, if you write and maintain the code | Thousands of settings per scan on our scan server |
| Test on unseen data | Rarely done | Only if you build the split yourself | In every report: search on 65 %, test on the last 35 % |
| Leverage risk in numbers | Guesswork | Only if you calculate it | Worst move inside a trade and the leverage that would have survived it |
| Trading around the clock | Only while you watch the screen | Needs your own server and monitoring | Your bot on your own server, checked every minute by a watchdog |
| Programming needed | No | Yes | No, you tap through the app |
| Who holds the exchange key | You | You | You, in the vault of your device and on your own server |
| Cost | Your time | Your time plus a server | From $49 a month plus a small server for about $12 a month |
If you are weighing M Alpha Core against other bot tools, our side by side pages cover M Alpha Core vs 3Commas, M Alpha Core vs Pionex, M Alpha Core vs Cryptohopper and M Alpha Core vs Gainium.
Limits of any backtest
- One split, one year. A single 65/35 split is a strong check, but it is still one period. Markets change, and next year can be very different.
- Using the unseen part twice. If you run many scans and keep the one with the best unseen result, the unseen part slowly becomes part of the search. Pick your market and time frame first and do not fish for a lucky result.
- Costs. Fees, slippage and funding reduce every result. A thin edge can disappear once costs are paid.
- Extreme events. A crash larger than anything in the test period is not covered by the test.
The guides on out of sample testing and how to backtest a trading strategy go deeper into these points.
Frequently asked questions
What is out of sample testing?
It means testing a strategy on data that was not used to find it. M Alpha Core uses the last 35 % of the test period for this.
Why 65 % and 35 %?
The search needs enough data to find settings, and the unseen part needs enough trades to say something. A 65/35 split in time order keeps both parts meaningful.
Is a good result on unseen data a guarantee?
No. It is a much stronger sign than a normal backtest, but markets change and past results are no promise.
What is overfitting?
Settings that fit the noise of past prices instead of a pattern that repeats. They look great in the backtest and fail afterwards.
What if the unseen result is much worse?
Then the settings were most likely fitted to noise. Do not trade them, however good the searched part looks.
Why can the unseen profit factor be higher than the searched one?
The unseen part is shorter, so a few lucky trades weigh more. Treat a higher value as a pass, not as a forecast.
How many trades does a test need?
The more the better. Our examples range from 89 trades for Nvidia to 153 for gold in their test periods.
Is this the same as walk forward testing?
It is a single walk forward step: search on the past, test on the following period. Full walk forward testing repeats this over many windows.
Which markets can I test?
Crypto, gold, silver, platinum, copper, oil, natural gas, the S&P 500, the Nasdaq 100 and more than 200 stocks.
Does the bot change its settings later?
No. The bot trades exactly the settings that passed the test. New settings need a new scan.
Compare M Alpha Core
Side by side with other bot tools, with sources for every statement about them.
Exchanges in M Alpha Core: Binance · Bybit · Bitget · OKX · MEXC · Gate · BingX · KuCoin · Crypto.com · Hyperliquid
Related pages
All figures come from backtests on past market data. No result is a promise of future profit. Trading, especially with leverage, involves high risk. M Alpha Core is a software tool, not investment advice.