
How M Alpha Core finds and tests strategy settings
Last updated:
M Alpha Core has one built-in strategy. The scan finds the best settings of that strategy for your market, and every number in the report comes from the same process. This page explains where the data comes from, how the test is split, which costs are included and where the limits of any backtest are, and it shows five real scans with their periods.
Market data
The scan server loads the candles itself, from the perpetual futures market of Binance, by default for the last 365 days. Gold, oil, indices and stocks are scanned through the perpetual contracts that Binance lists for them. Scan, report and chart use the same candles.
Search on 65 %, test on 35 %
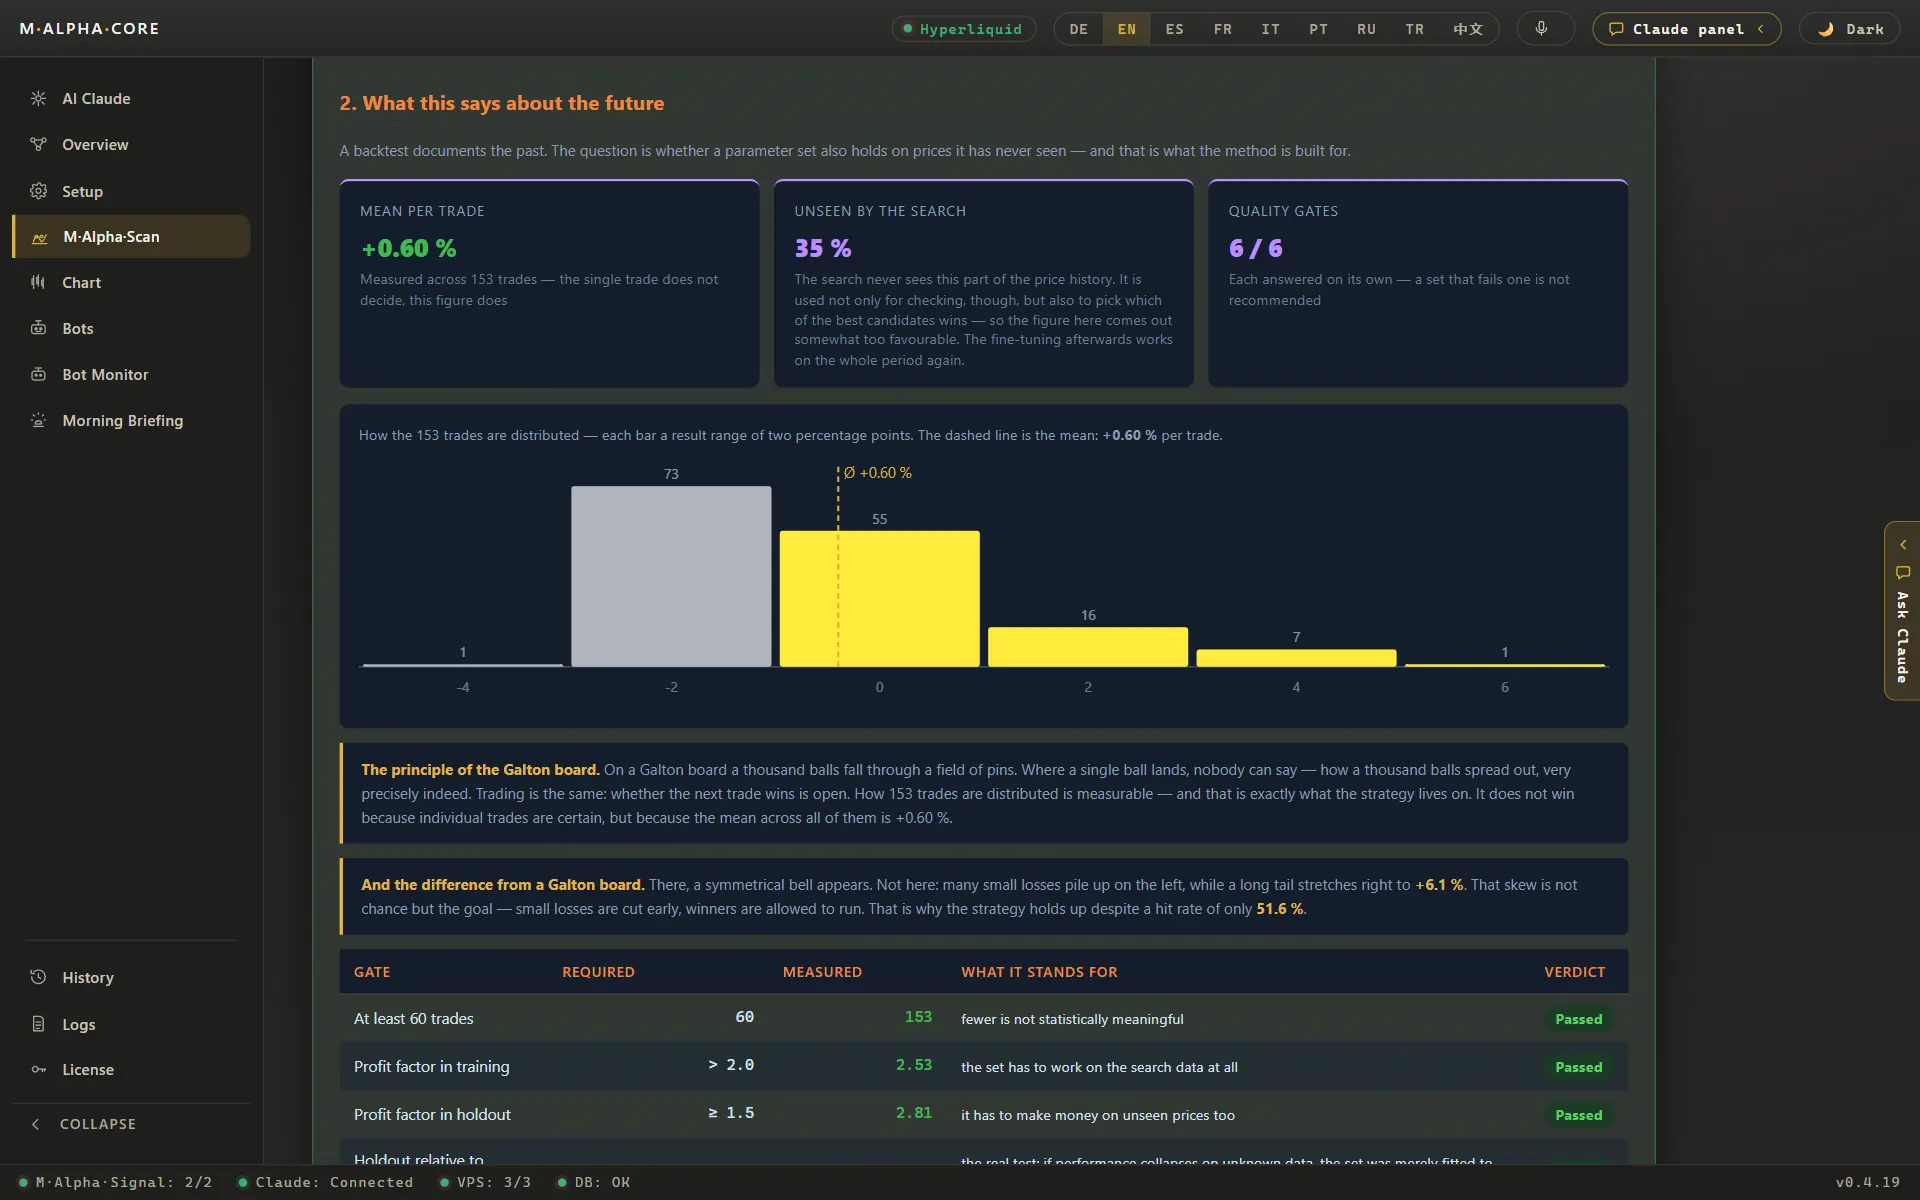
The scan tries thousands of settings of the built-in strategy on the first 65 % of the period. The last 35 % stay locked away during the search. Only then does the best result run on this unseen part. If a result works on the searched part but fails on the unseen part, it was most likely fitted to noise.
Profit factor
The profit factor is the total of all winning trades divided by the total of all losing trades. A profit factor of 2 means two dollars won for every dollar lost. Below 1 the strategy lost money. The scan shows it separately for the searched and for the unseen part.
Costs in the backtest
Every trade pays a fee of 0.05 % when it opens and 0.05 % when it closes. An order is filled at the open of the candle after the signal. Funding payments and slippage are not included, so real results can be lower.
Leverage limit from the worst trade
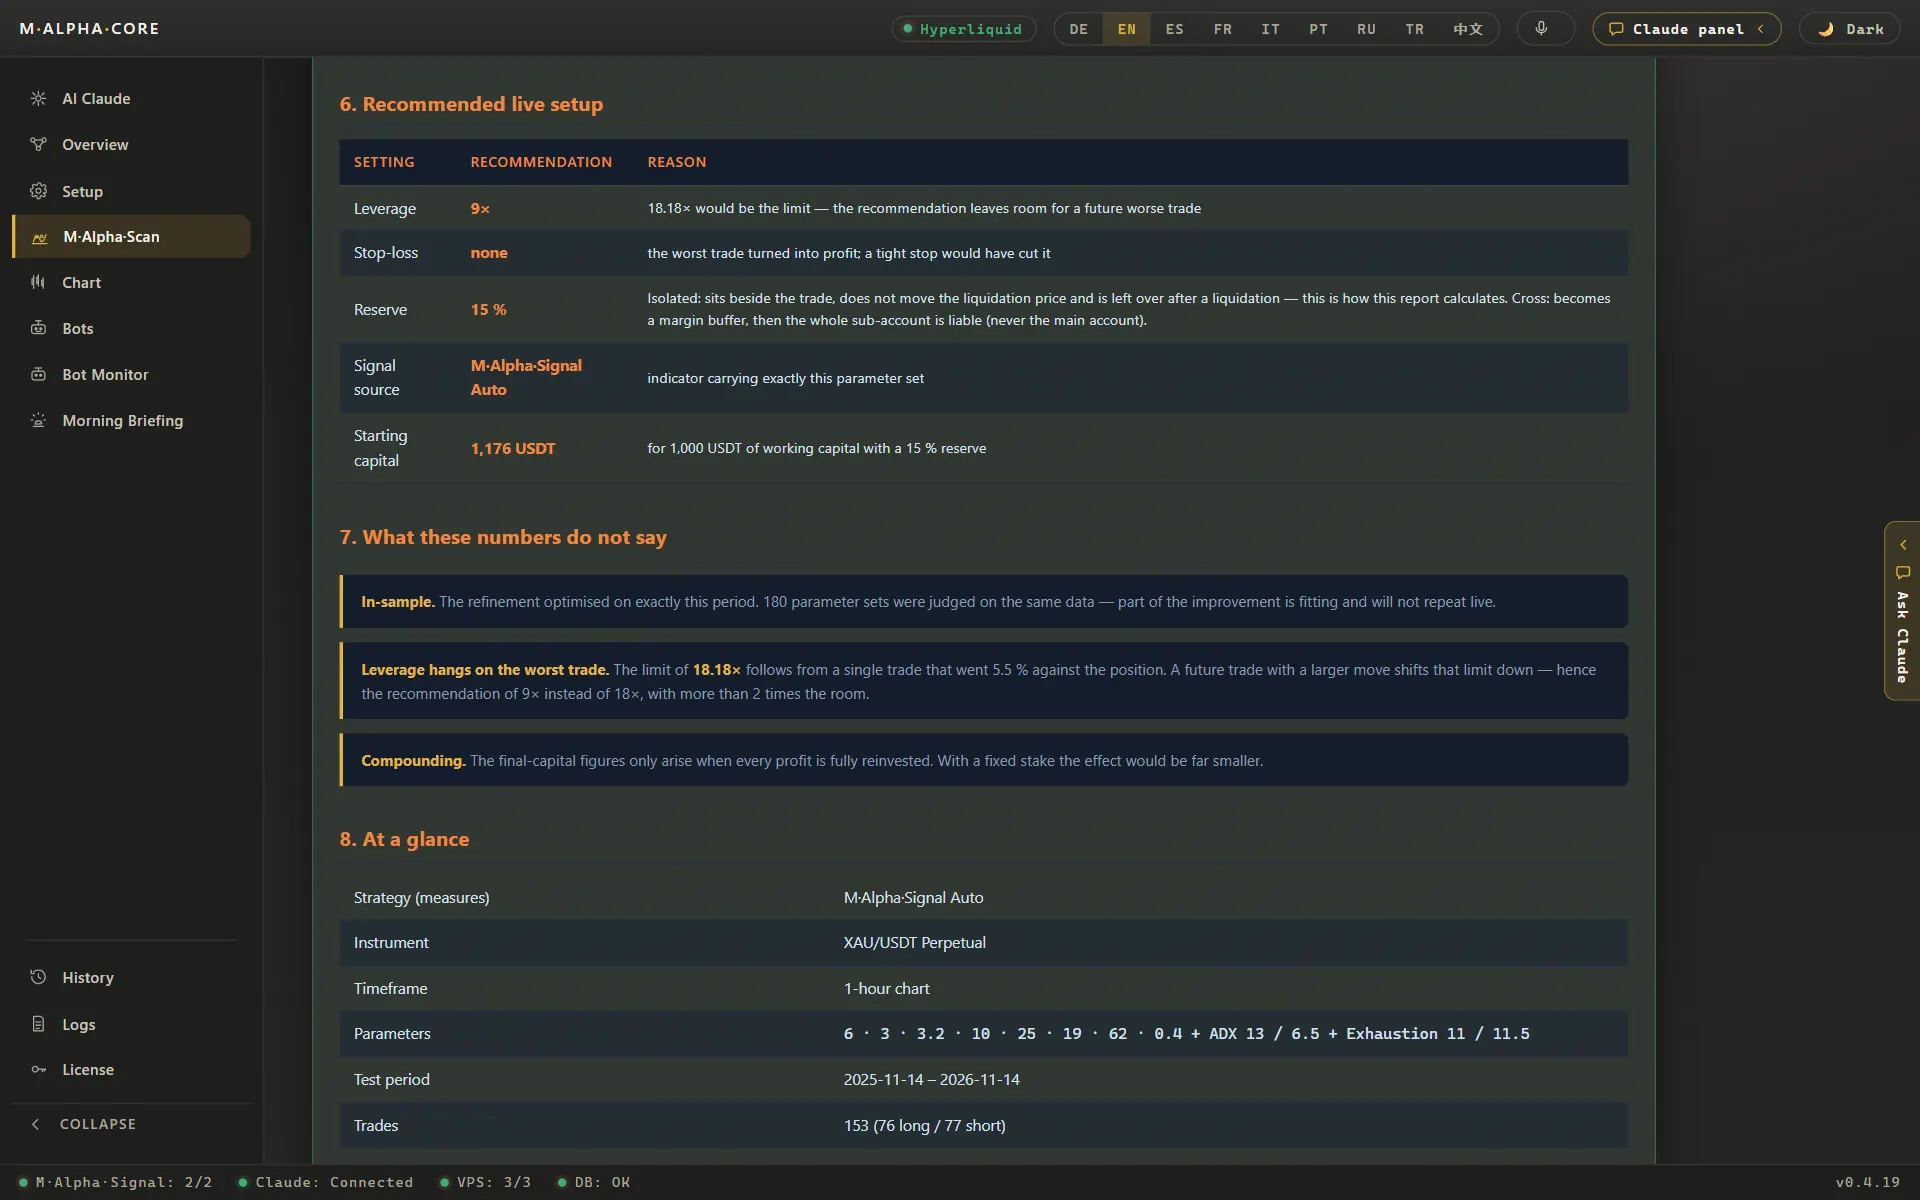
For every trade the report measures how far the price moved against the position before the trade closed. The leverage limit is 100 divided by the largest of these moves in percent, measured over every trade in the report. The recommended leverage is half of that limit, rounded down. Results with leverage are compounded and include liquidation: if a move against you times the leverage reaches 100 %, that trade loses its full stake.
Five real scans with their evidence
Each box shows one scan as it was run: the contract, the chart, the period of data actually used, the date of the scan and the figures. Where Binance has listed a contract for less than a year, the scan uses all the history there is, so the period can be shorter than a year.
Gold (XAUUSDT), chart: 1 hour
| Contract | XAUUSDT, Binance perpetual |
|---|---|
| Chart | 1 hour |
| Data used | December 11, 2025 to November 12, 2026 (336 days) |
| Scan date | November 12, 2026 |
| App version | 0.4.19 |
| Trades searched / unseen | 95 / 58 |
| Profit factor, searched 65 % | 2.53 |
| Profit factor, unseen 35 % | 2.81 |
| Profit factor, all trades in the report | 2.46 |
| $1,000 without leverage | $2,446 |
| $1,000 at 3x | $11,993 |
| $1,000 at 5x | $46,664 |
| $1,000 at the recommended 9x | $387,217 |
| Worst move against a trade | 5.49 % |
| Leverage limit | 100 / 5.49 = 18.2x |
| Recommended leverage | 9x |
| Source | Result file of the scan server and report in the app |
S&P 500 (SPYUSDT), chart: 30 minutes
| Contract | SPYUSDT, Binance perpetual |
|---|---|
| Chart | 30 minutes |
| Data used | April 6, 2026 to November 12, 2026 (220 days) |
| Scan date | November 12, 2026 |
| App version | 0.4.19 |
| Trades searched / unseen | 63 / 27 |
| Trades in the report | 91 |
| Profit factor, searched 65 % | 2.05 |
| Profit factor, unseen 35 % | 2.56 |
| Profit factor, all trades in the report | 2.13 |
| $1,000 without leverage | $1,227 |
| $1,000 at 3x | $1,804 |
| $1,000 at 5x | $2,577 |
| $1,000 at the recommended 24x | $23,934 |
| Worst move against a trade | 2.0 % |
| Leverage limit | 49.52x |
| Recommended leverage | 24x |
| Source | Result file of the scan server and report in the app |
Nvidia (NVDAUSDT), chart: 30 minutes
| Contract | NVDAUSDT, Binance perpetual |
|---|---|
| Chart | 30 minutes |
| Data used | March 26, 2026 to November 12, 2026 (231 days) |
| Scan date | November 12, 2026 |
| App version | 0.4.19 |
| Trades searched / unseen | 66 / 23 |
| Profit factor, searched 65 % | 2.19 |
| Profit factor, unseen 35 % | 4.90 |
| Profit factor, all trades in the report | 2.44 |
| $1,000 without leverage | $2,250 |
| $1,000 at the recommended 4x | $14,137 |
| $1,000 at 5x | $21,521 |
| Worst move against a trade | 11.1 % |
| Leverage limit | 9.03x |
| Recommended leverage | 4x |
| Source | Result file of the scan server and report in the app |
Nasdaq 100 (QQQUSDT), chart: 30 minutes
| Contract | QQQUSDT, Binance perpetual |
|---|---|
| Chart | 30 minutes |
| Data used | April 6, 2026 to November 12, 2026 (220 days) |
| Scan date | November 12, 2026 |
| Trades searched / unseen | 63 / 38 |
| Profit factor, searched 65 % | 2.34 |
| Profit factor, unseen 35 % | 2.17 |
| $1,000 without leverage | $1,548 |
| $1,000 at 5x | $6,929 |
| Source | Result file of the scan server and our notes from the report in the app |
Ethereum (ETHUSDT), chart: 30 minutes
| Contract | ETHUSDT, Binance perpetual |
|---|---|
| Chart | 30 minutes |
| Data used | November 6, 2025 to November 6, 2026 (365 days) |
| App version | 0.4.19 |
| Trades in the report | 116 |
| Profit factor, all trades in the report | 2.62 |
| $1,000 without leverage | $5,568 |
| $1,000 at the recommended 3x | $78,106 |
| Worst move against a trade | 15.64 % |
| Second worst move | 10.11 % |
| Leverage limit | 100 / 15.64 = 6.39x |
| Recommended leverage | 3x |
| Source | Report and chart in the app |
Why two kinds of profit factor? The scan shows the searched and the unseen part separately. The report then recalculates the chosen settings over the whole period and shows one profit factor across all trades. The leverage limit always follows the same formula: 100 divided by the worst move against a trade. For gold that is 100 / 5.49 = 18.2x, halved and rounded down 9x. For Ethereum it is 100 / 15.64 = 6.39x, halved and rounded down 3x. The dollar amounts start at $1,000 and are compounded.
Glossary: profit factor, out of sample, leverage, liquidation, funding rate, drawdown
Limits of any backtest
A backtest shows how settings would have done on past data, not how they will do. Markets change, and even settings that hold up on unseen data can fail later. Compounded results grow fast on paper and react strongly to a single bad trade. That is why the report shows every trade, including the losers, and why we suggest the dry run mode or small amounts first.
See the process in the demo and on the screenshots: Try the demo · Screenshots · Backtest on unseen data
All figures come from backtests on past market data. No result is a promise of future profit. Trading, especially with leverage, involves high risk. M Alpha Core is a software tool, not investment advice.