
Home / Guides / Out of sample testing
Out of sample testing for trading strategies
Out of sample testing is the simplest defence against a strategy that only works in hindsight. This guide explains overfitting, how a clean split works, what walk forward analysis adds and how to read the result.
Last updated:
The problem: overfitting
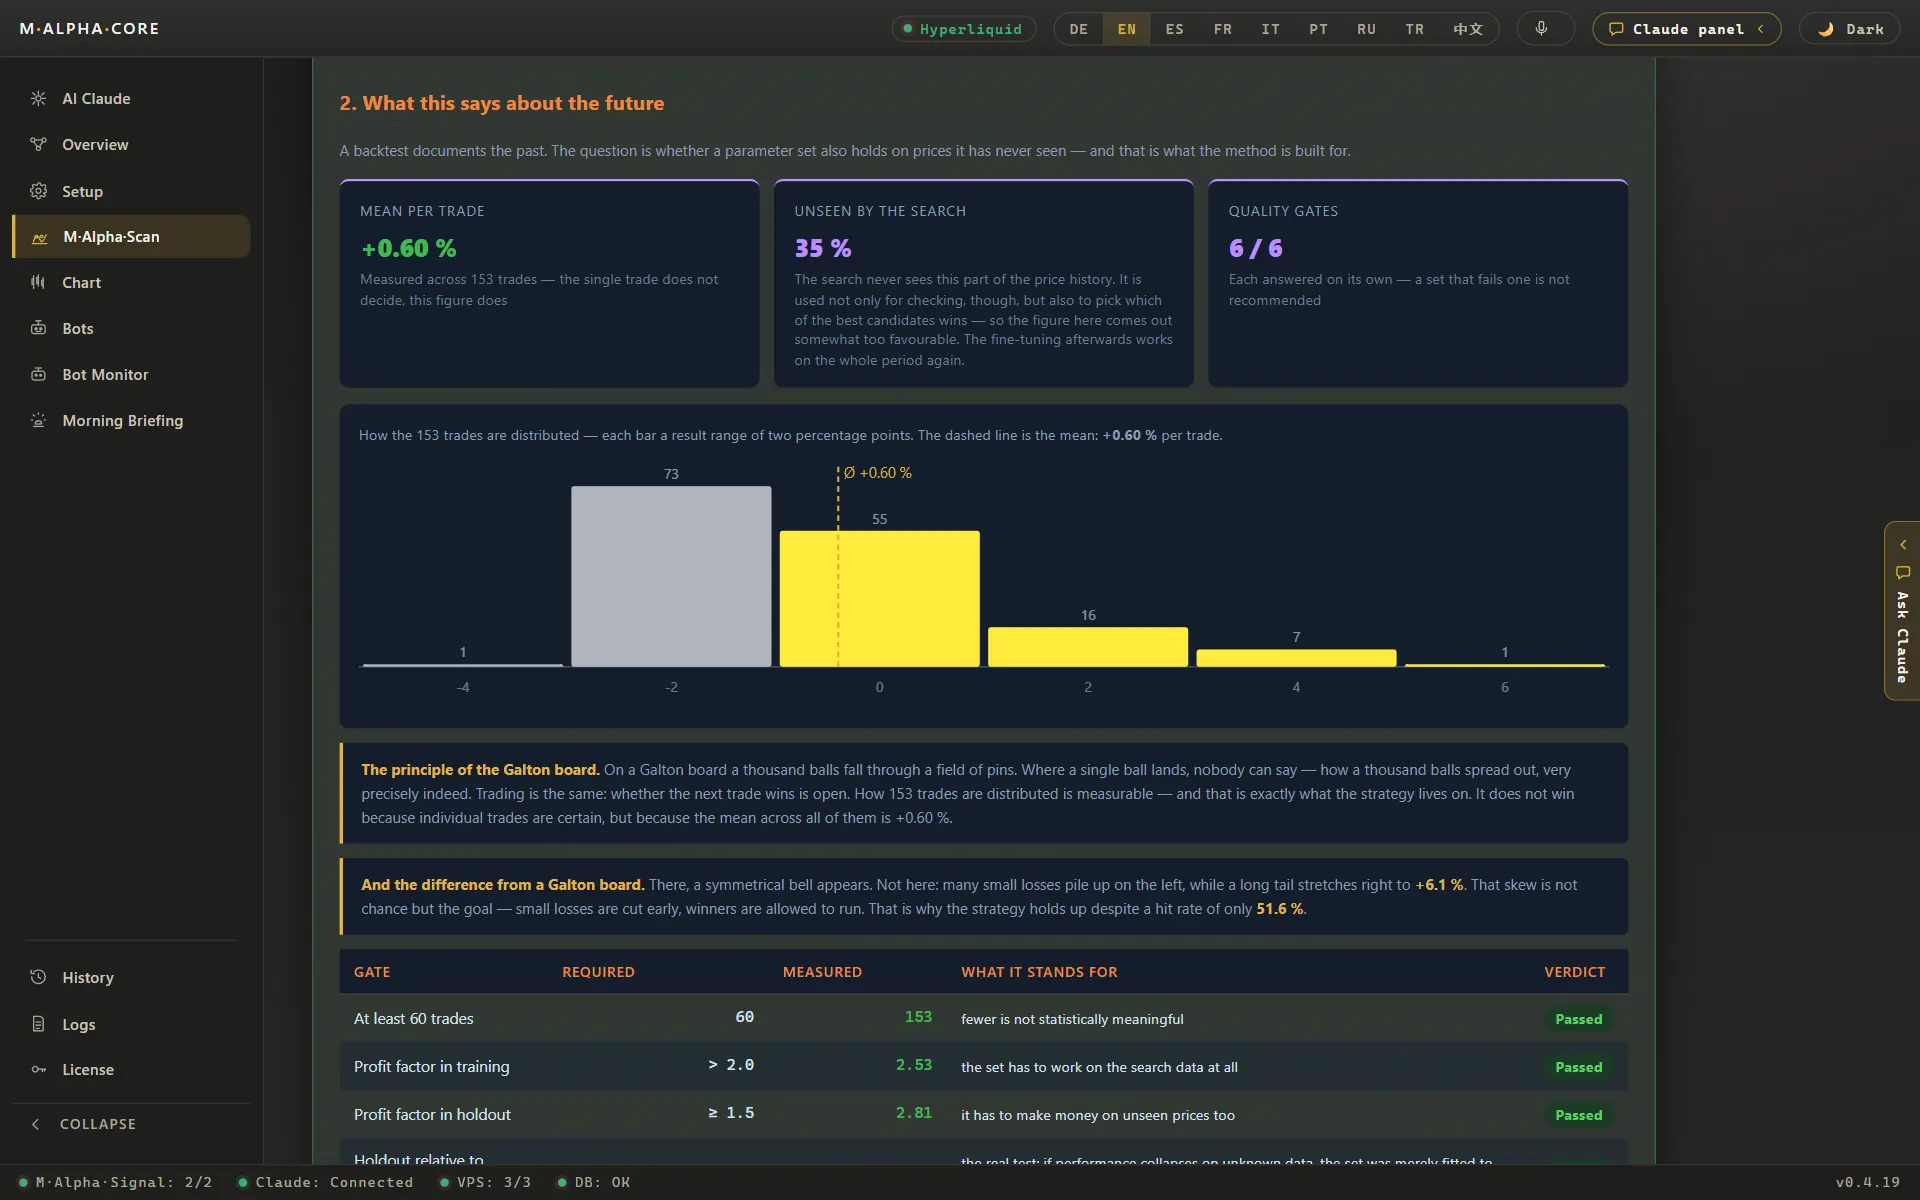
Imagine you flip a coin a hundred times and then search for a rule that would have predicted the flips. With enough rules to choose from, you will find one that looks brilliant. It will be worthless on the next hundred flips, because there was nothing to find. It only memorised the past.
Trading strategies have the same problem. Prices contain patterns that repeat and a lot of noise that does not. A search over many settings will happily fit the noise. The result is called an overfitted strategy: a perfect backtest and a poor live record. The more settings a search tries, and the more knobs a strategy has, the easier overfitting becomes.
You cannot see overfitting by looking at the backtest that produced it. The curve looks the same whether the strategy found a real pattern or just noise. You need data the search did not use.
In sample and out of sample
In sample data is the part used to develop or tune the strategy. Out of sample data is the part kept aside and used only once, for the final check. The rules are fixed before that check, and nothing is changed after it.
The idea is simple: the out of sample part plays the role of the future. The search could not see it, so any pattern that also works there is less likely to be pure chance. It is not proof. It is a far better sign than any in sample result.
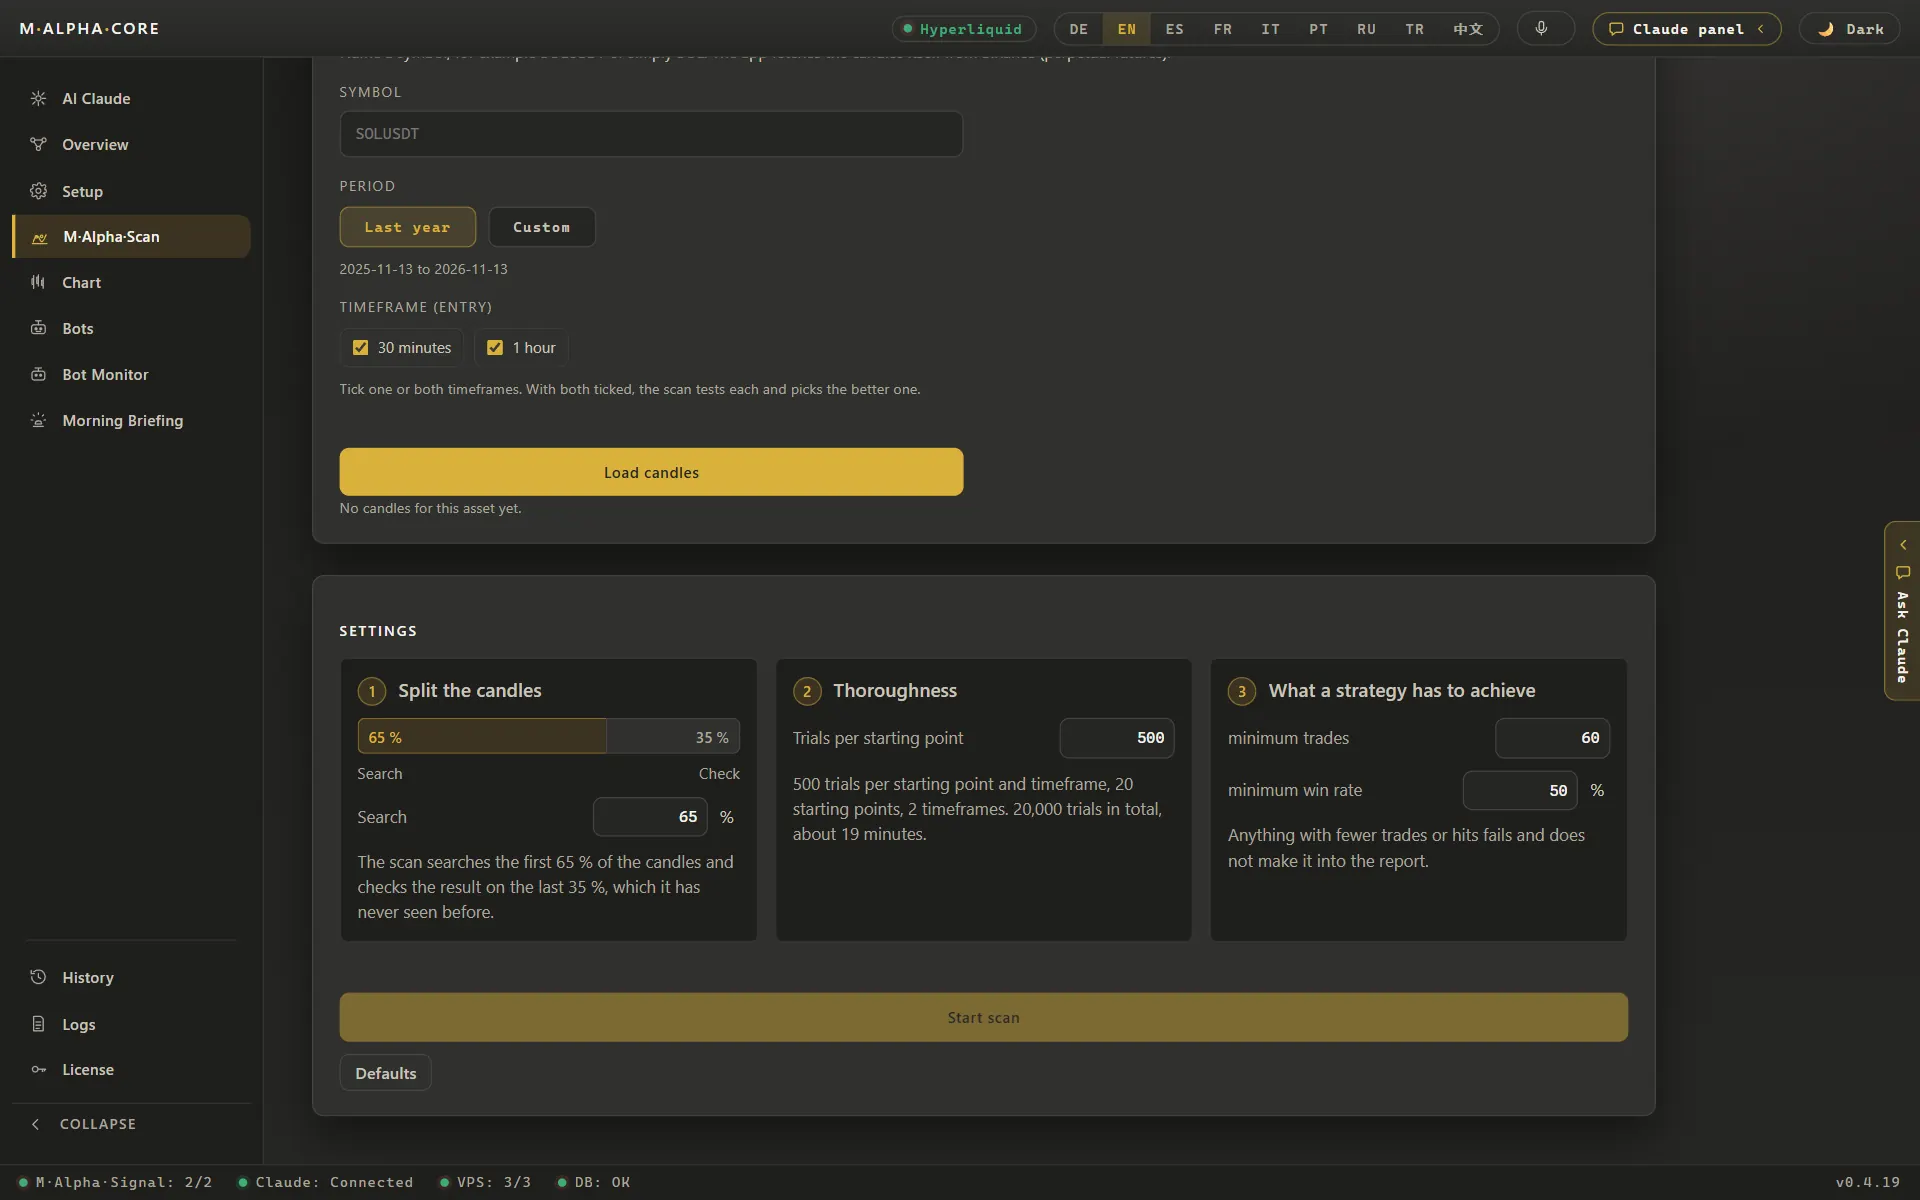
How M Alpha Core splits the data: 65/35
Every scan in M Alpha Core uses about a year of data on the chosen time frame. The first 65 % is in sample. The scan tests thousands of settings of the built in strategy there and picks the best. The last 35 % is out of sample. The chosen settings run on it once, unchanged. The report shows both results side by side, so you can compare them at a glance.
The methodology page lists the exact markets, dates and figures behind our examples. Why these shares? The search needs enough data to find settings that cover different market phases. The check needs enough trades to say something. With 65/35 on one year, the check still covers about four months. In our gold example the test period held 153 trades, so the unseen part still had a meaningful number of them.
Why time order matters
The split must follow time. The out of sample part comes after the in sample part, just as tomorrow comes after today. If you pick random days or months for the check, information from later periods ends up in the search. Market phases last weeks or months, so neighbouring days are similar. A random split then tests the strategy on days that look almost exactly like days it was tuned on, and the result looks better than it is. This is one form of data leakage.
Walk forward analysis
Walk forward analysis repeats the in sample and out of sample idea several times. You search on a window, test on the period right after it, then move both windows forward and do it again. At the end you join all the out of sample periods into one result.
The advantage: you get more out of sample data and see whether the strategy keeps working as the market changes. The cost: it takes much more computing time, and the settings change from window to window, which makes the live strategy harder to follow.
The 65/35 split in M Alpha Core is one walk forward step: one search window, one test window after it. When you run a new scan later, on newer data, you are in effect taking the next step. Comparing the reports of those scans over time tells you whether a market keeps behaving the way the strategy needs.
How to read an out of sample result
| Gold, 1 hour: profit factor in sample / out of sample | 2.53 / 2.81 |
| Nvidia: profit factor in sample / out of sample | 2.19 / 4.90 |
| Nasdaq 100: profit factor out of sample | 2.17 |
| Gold: trades in the test period | 153 |
| Nvidia: trades in the test period | 89 |
Values from our own scans with the 65/35 split.
- Similar or slightly better out of sample, as with gold: the settings were not tied to the exact months of the search. That is a pass.
- Much better out of sample, as with Nvidia: also a pass, but be careful. The out of sample part is shorter and holds fewer trades, so a few lucky trades weigh more. Do not expect the higher value to continue.
- Clearly worse out of sample: the search probably fitted noise. A drop from about 2.5 to about 1 is a clear fail, however good the in sample curve looked.
- Below 1 out of sample: the settings lost money on data they had not seen. Do not trade them.
Also look at the number of trades in each part. A profit factor from a dozen trades can swing widely by chance.
Pitfalls that ruin the test
- Peeking. You look at the out of sample result, change one setting, and look again. After a few rounds, the out of sample part is in sample.
- Fishing across markets. You scan twenty markets and only keep the one with the best out of sample result. Some of that is luck. Decide on your market first.
- Too short a check. A few weeks of out of sample data often hold too few trades.
- Look ahead in the rules. If a rule uses data from the future, even a perfect split cannot save the test.
- No costs. Fees, slippage and funding belong in both parts.
Out of sample and leverage
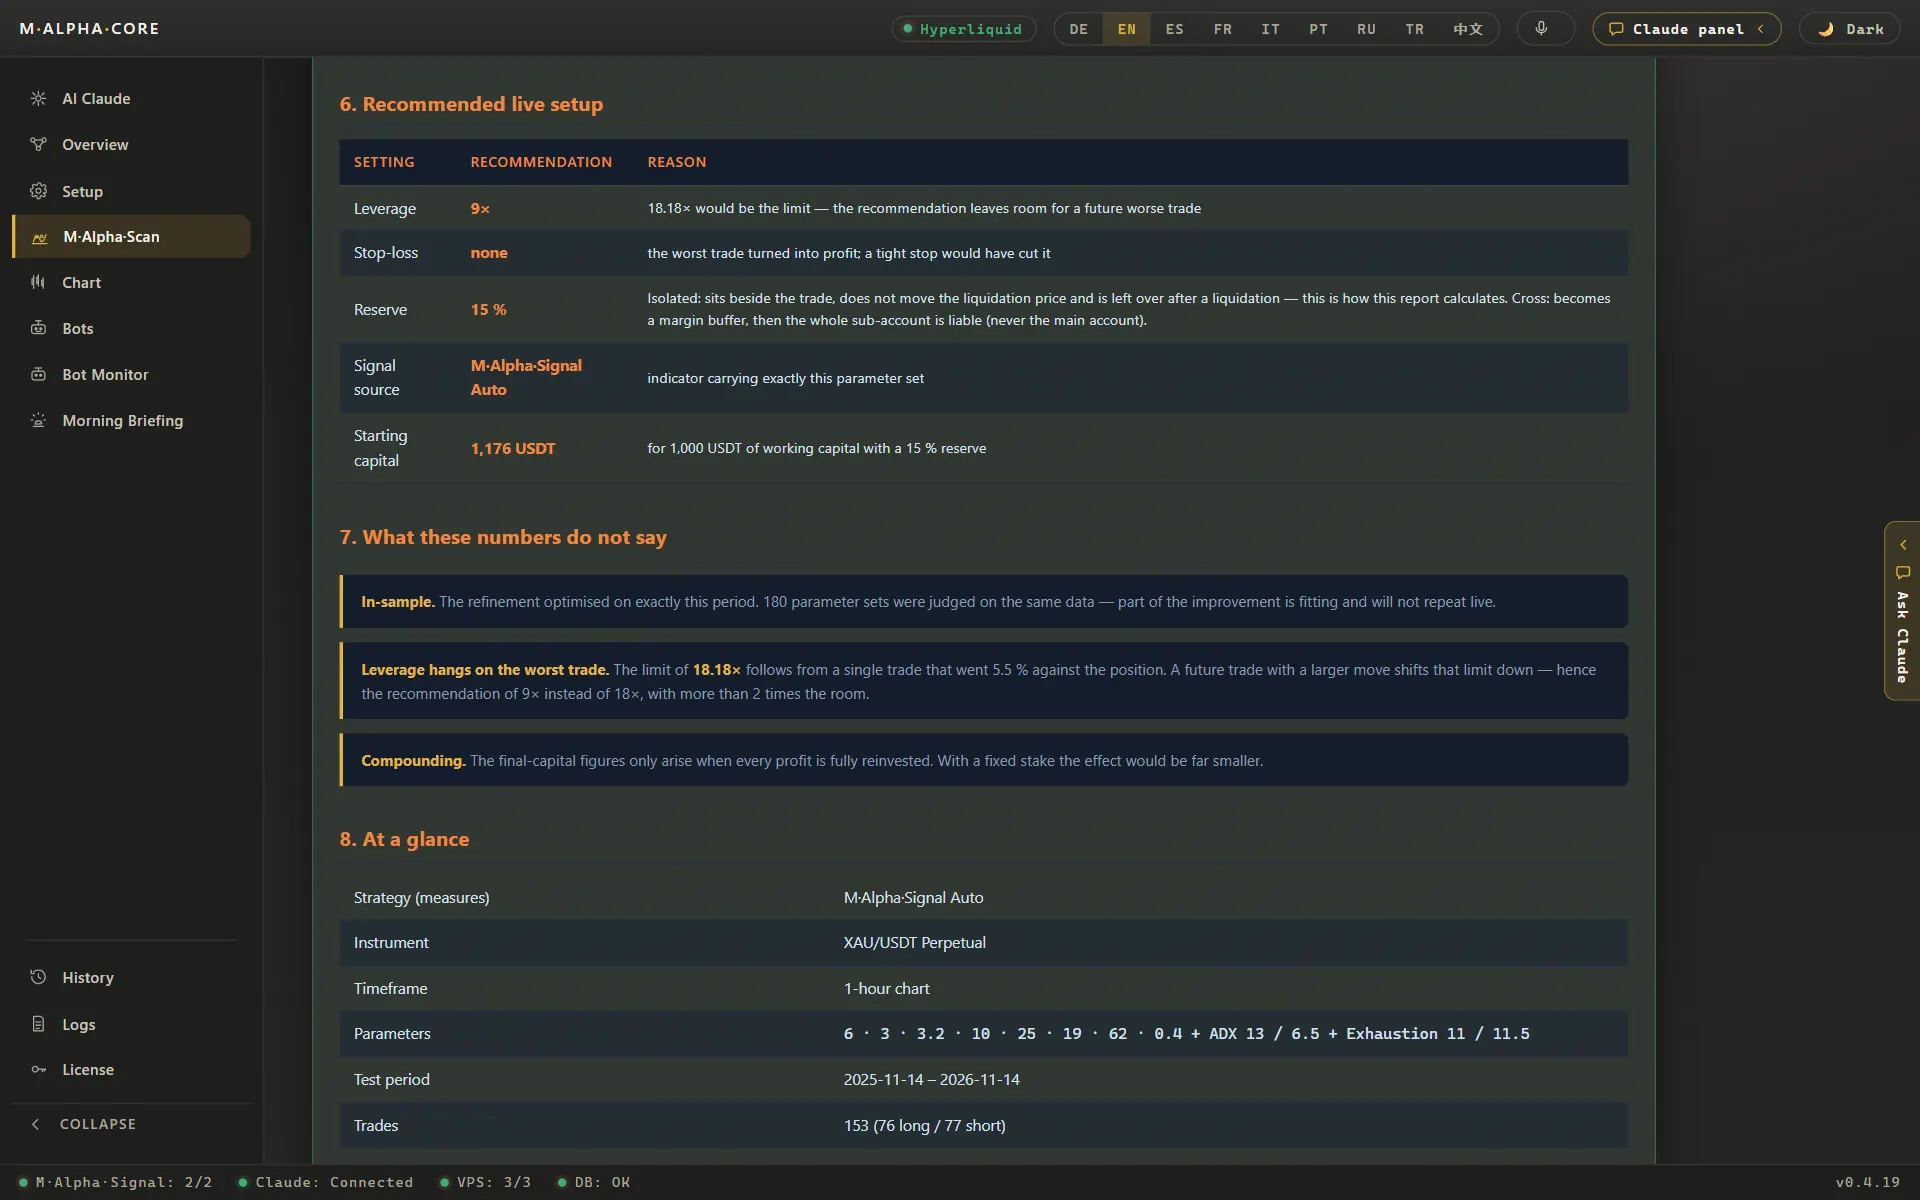
A pass on unseen data says the rules found something real. It does not say how much leverage they can carry. For that, look at the worst move against a single trade. In an ETH example the worst move was 15.64 %, so anything above 6.39x would have liquidated that trade. For gold the limit was 18.2x and for Nvidia 9.03x. M Alpha Core shows this limit in every report, and the leverage and liquidation calculator lets you test the relation yourself.
After the test: dry run and live
A passed out of sample test is the start, not the end. The next check is a dry run on live prices: the bot records what it would do without sending orders. Then a small live stake. M Alpha Core follows exactly this order and, every Sunday, compares what the bot would have made on its own with what really happened on your account. Read the guide on how to test a crypto trading bot for the full sequence, and the security page for how your exchange key is kept on your own server.
Frequently asked questions
What is out of sample testing?
Testing a strategy on data that was not used to develop or tune it. The rules are fixed before the test and not changed after it.
What is in sample data?
The part of the data used to develop or tune a strategy. M Alpha Core uses the first 65 % of the year.
What is overfitting in trading?
A strategy that fits the noise of past prices instead of a repeating pattern. It looks great in the backtest and fails afterwards.
What is walk forward analysis?
Repeating the search and test on moving windows of time and joining all test periods into one result.
Is the 65/35 split walk forward testing?
It is one walk forward step: one search window and one test window right after it.
Why not split the data randomly?
Neighbouring days are similar, so a random split lets information from the test period leak into the search.
What if the out of sample result is better?
It is a pass, but the shorter period holds fewer trades. Do not expect the higher value to continue.
Can I look at the out of sample result and adjust?
Not without spoiling it. Once you tune on it, it becomes in sample data.
Does a pass out of sample guarantee profit?
No. It is a strong sign, but markets change and no backtest is a promise.
How much out of sample data is enough?
Enough to hold a meaningful number of trades. With one year and a 35 % share, the check covers about four months.
Compare M Alpha Core
Side by side with other bot tools, with sources for every statement about them.
Exchanges in M Alpha Core: Binance · Bybit · Bitget · OKX · MEXC · Gate · BingX · KuCoin · Crypto.com · Hyperliquid
Related pages
All figures come from backtests on past market data. No result is a promise of future profit. Trading, especially with leverage, involves high risk. M Alpha Core is a software tool, not investment advice.