
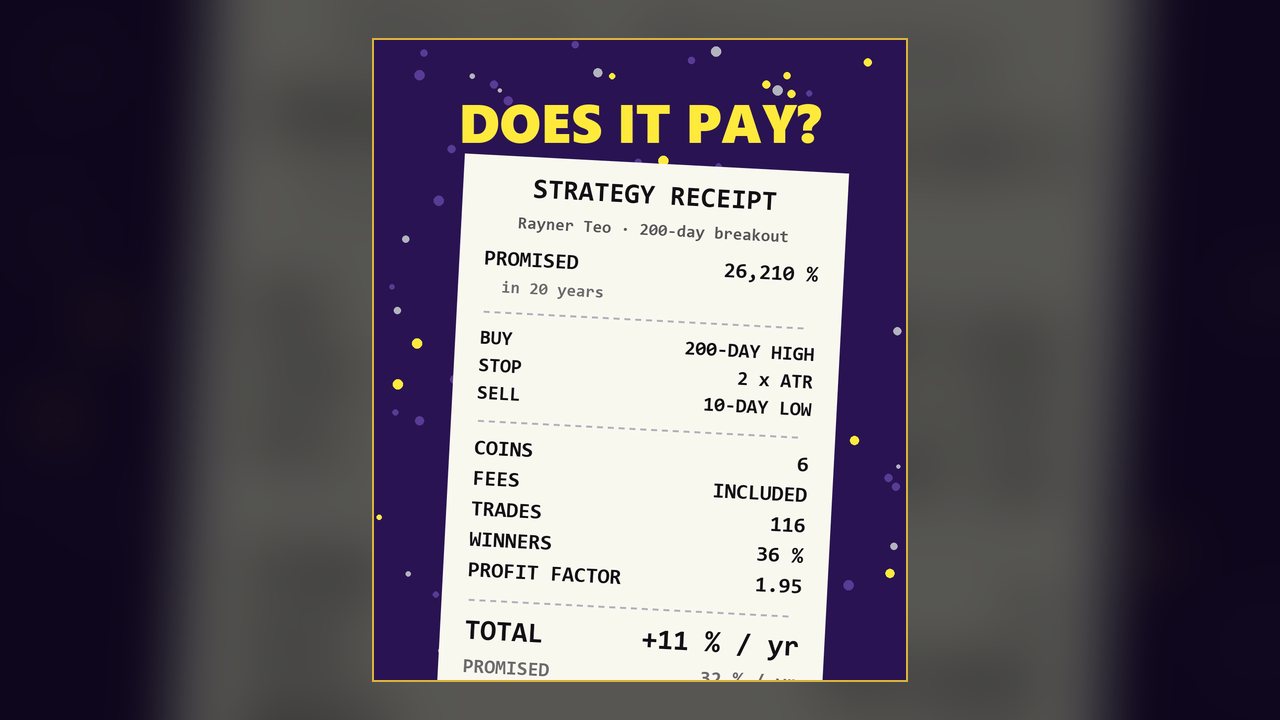
Rayner Teo enhanced Turtle breakout strategy re-tested on crypto
October 27, 2026 · 0:44
The 26,210 % Turtle breakout on 6 coins with real fees: 116 trades, 36 % winners, about 11 % a year. Not 32 %, but real profit.
Home / Videos / Seven famous YouTube trading strategies ranked by profit factor after fees
Published on October 27, 2026 · Length 1:05 · Last updated: November 13, 2026
We re-tested seven well known trading strategies from YouTube on crypto perpetuals, all with real exchange fees, and ranked them by profit factor after fees. A profit factor above 1.00 means the strategy made money: winning trades brought in more than losing trades cost. Below 1.00 it lost.
The ranking from last to first. Number seven: TJR's 1 minute scalping, with a profit factor of 0.54 even in the version with a wider stop. Number six: Data Trader's 5 minute scalping at 0.77. Number five: Data Trader's MACD and Parabolic SAR at 0.90. Number four: Trading Rush's MACD with the 200 EMA at 0.94. Number three: Trade Pro's Heikin Ashi at 0.97. Number two: Data Trader's Stochastic, RSI and MACD at 0.99, almost break even but still a loss.
Six out of seven lost money after fees. Number one was Rayner Teo's RSI pullback: 76 % winners and a profit factor of 6.22, so more than six dollars won for every dollar lost. The catch: only 37 trades in almost six years. It trades rarely, and a small number of trades always means more uncertainty.
A pattern shows up in the list. The short time frames sit at the bottom, because many small trades pay fees again and again. The strategies in the middle hover near 1.00, close enough to look fine in a short test without fees, but not good enough to pay for the cost of trading. Each strategy has its own video and page with the rules and the full numbers, linked from the video overview.
Your broker earns a fee on every one of these trades, whether they win or lose. That is why we always look at the result after fees, over many trades and several markets. These rules come from a YouTube video and were re-tested by us with our own research code. They are not part of the app. M Alpha Core has one built-in strategy: its scan finds the best settings of that strategy for your market and then checks them on months the search never saw. The lesson from this video is the same one the app is built on: judge a strategy by the full record of trades after fees, not by a headline number.
More on this topic: How to backtest a trading strategy.
October 27, 2026 · 0:44
The 26,210 % Turtle breakout on 6 coins with real fees: 116 trades, 36 % winners, about 11 % a year. Not 32 %, but real profit.
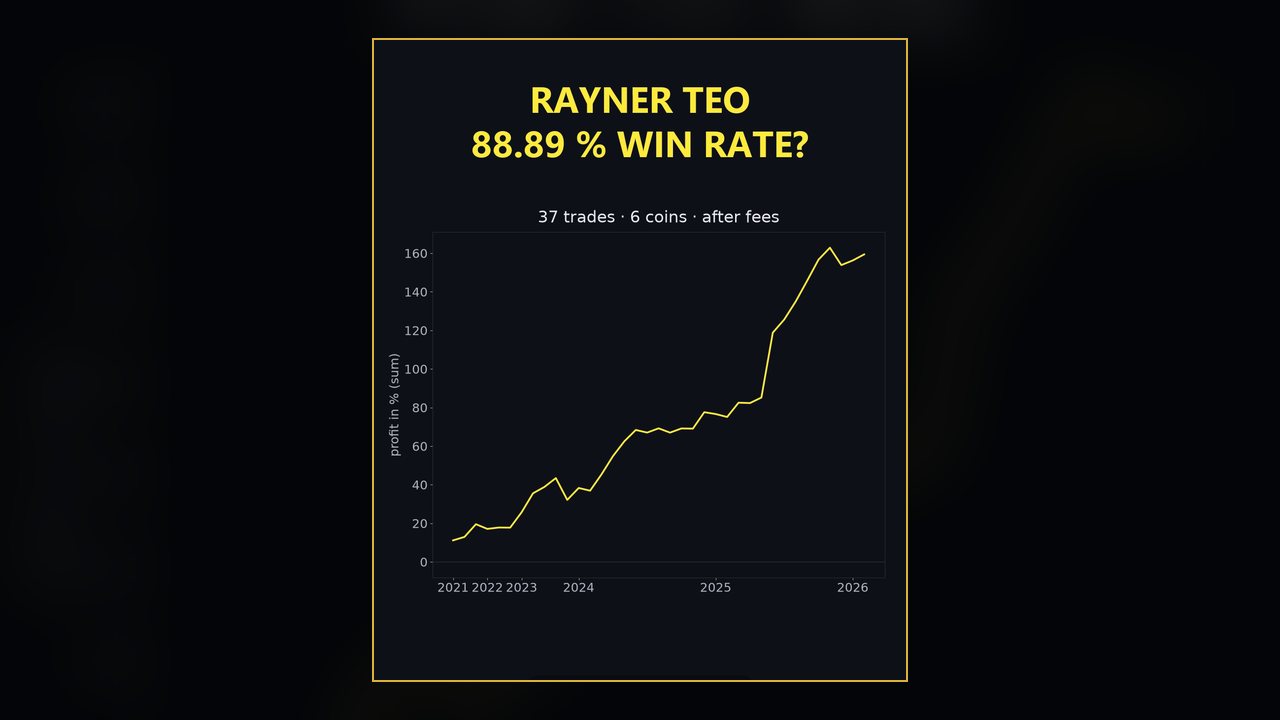
October 26, 2026 · 0:36
The RSI 10 pullback with an 88.89 % win rate held up on crypto: 76 % winners and a clear profit, but only 37 trades in almost six years.
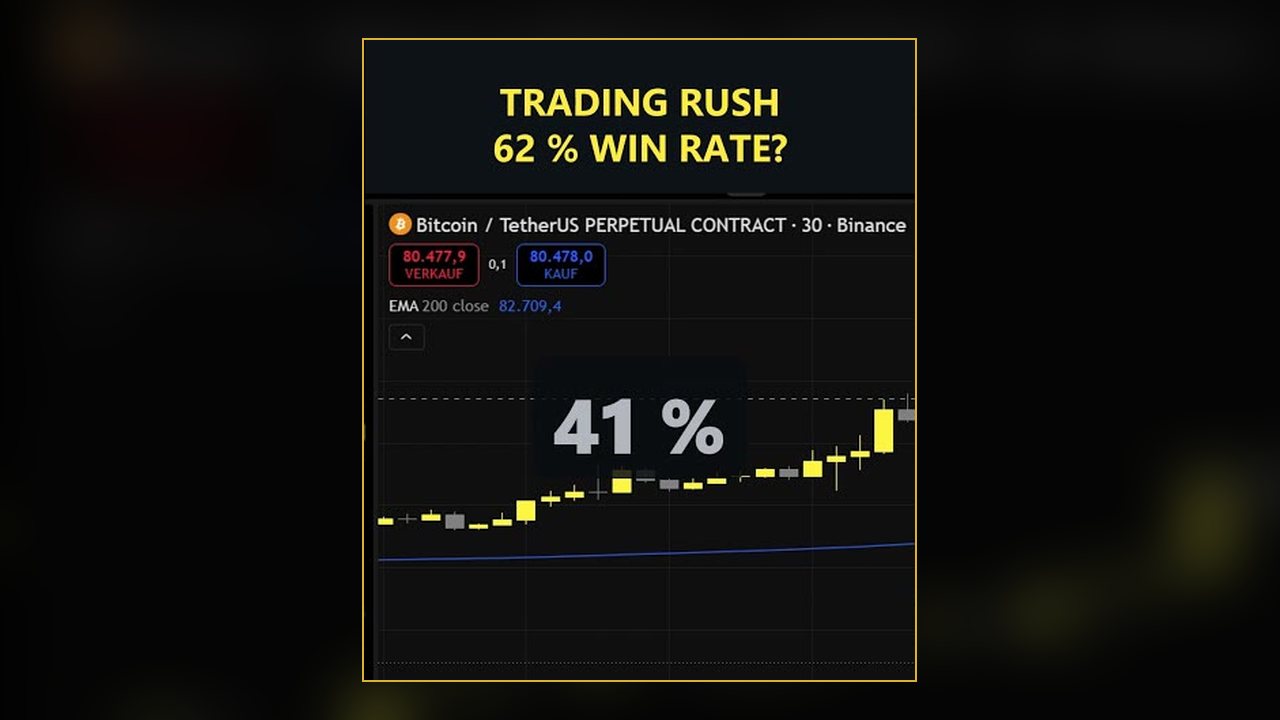
October 26, 2026 · 0:33
Trading Rush's MACD and 200 EMA rules on 6 coins over 6 years with real fees: over 6,000 trades and a small loss.
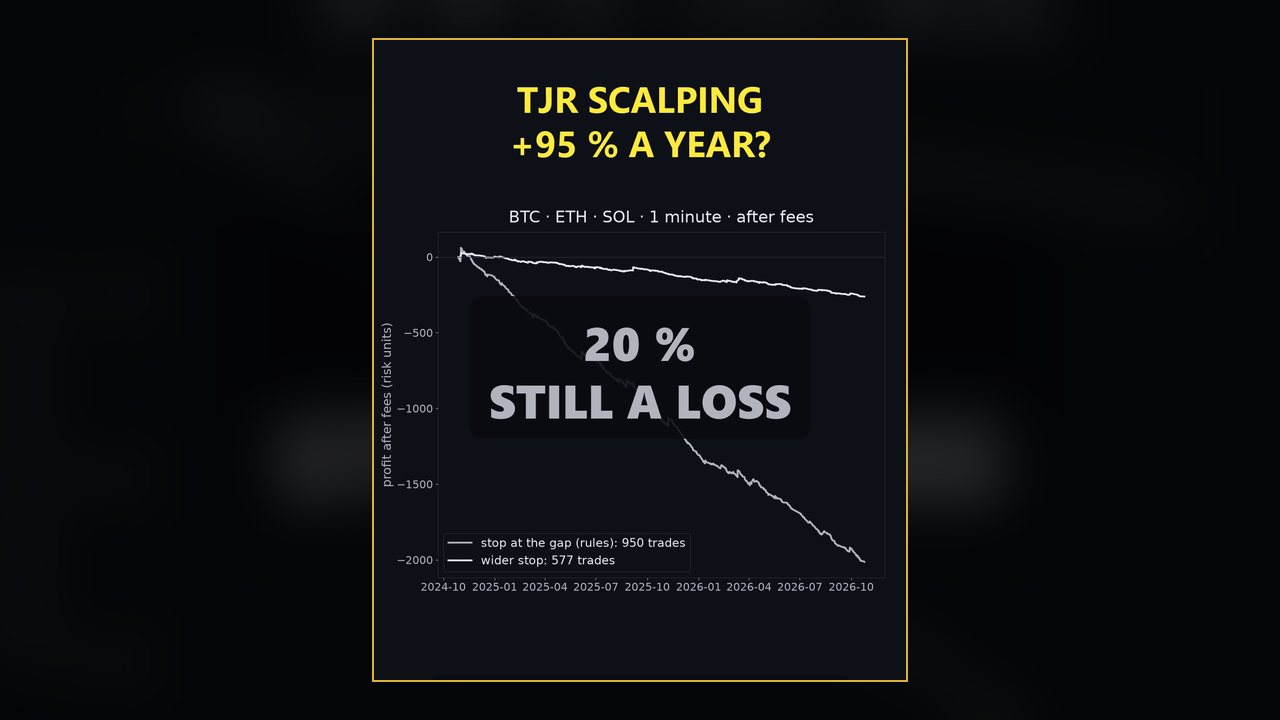
October 27, 2026 · 0:42
TJR's scalping rules on Bitcoin, Ethereum and Solana 1 minute charts: 6 % winners with the stop from the rules, 20 % with a wider stop, both a loss.
All figures come from backtests on past market data. No result is a promise of future profit. Trading, especially with leverage, involves high risk. M Alpha Core is a software tool, not investment advice.