
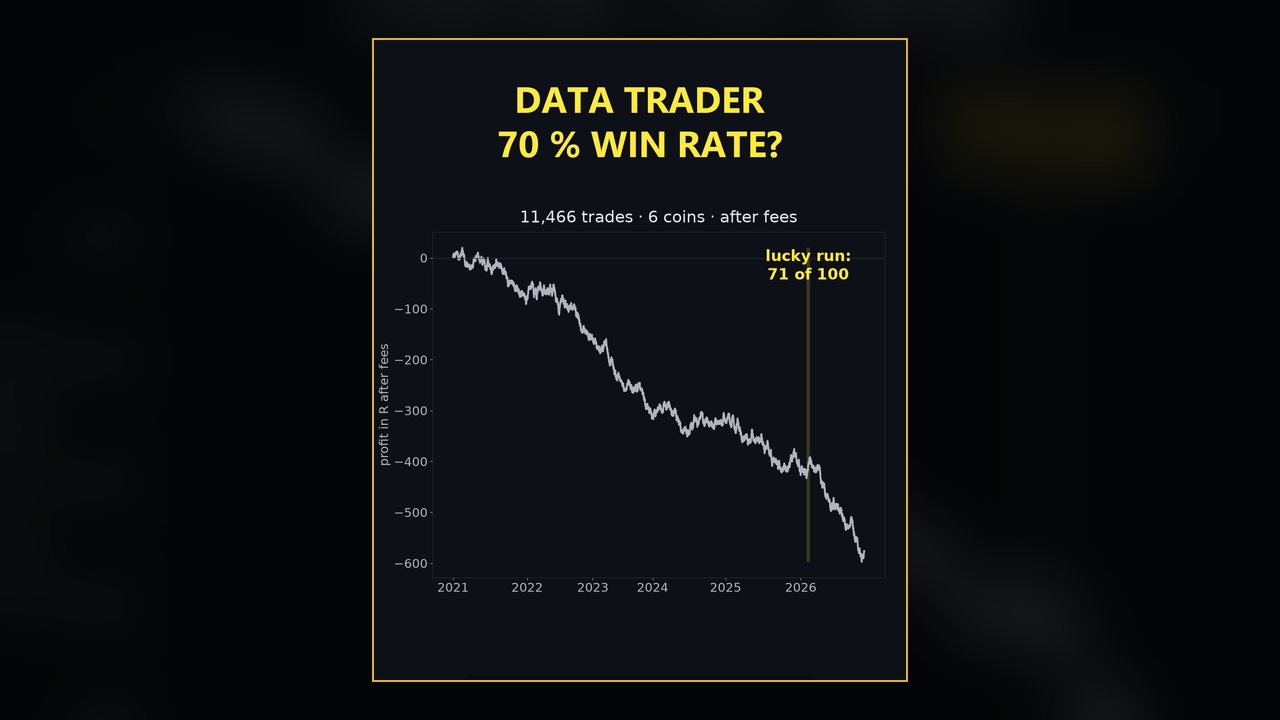
Data Trader MACD and Parabolic SAR strategy: 11,466 trades re-tested
October 26, 2026 · 0:41
The 70 % MACD and Parabolic SAR strategy on 6 coins, 2021 to 2026: 11,466 trades, a 50 % win rate and a loss after fees in every year.
Home / Videos / Data Trader Stochastic, RSI and MACD strategy: 4,944 trades re-tested
Published on October 27, 2026 · Length 0:31 · Last updated: November 13, 2026
Data Trader's Stochastic, RSI and MACD strategy promises 56 % winners and has more than 800,000 views. In the original video the result came from 100 trades on EUR/USD on the 30 minute chart, with a gain of 28 % at 2 % risk per trade.
The rules combine three indicators. For a long, the Stochastic (14, 3, 3) first has to be oversold with both lines below 20. The RSI (14) has to be above 50. Then the MACD line crosses above its signal line while the Stochastic is not yet overbought. The stop goes below the last swing low and the target is one and a half times the risk. Shorts are the mirror image.
We tested the rules on six crypto coins from 2021 to 2026 with real exchange fees. Over six years they produced 4,944 trades. The win rate was 42 %, not 56 %. After fees the result was almost exactly zero. In our ranking of seven famous YouTube strategies it came second, with a profit factor of 0.99: nearly break even, but still a small loss.
A lot of work for nothing is the honest summary. Three indicators have to line up, you wait for each signal, and at the end of six years the account is where it started, minus the time. That is still a better result than most strategies in the series, and it shows something useful: with a target of 1.5 times the risk you need 40 % winners just to break even before fees. At 42 % there is almost no room left once fees are paid.
If you plan your own test, our guide on out of sample testing explains why the months you use to choose rules should not be the months you judge them on. These rules come from a YouTube video and were re-tested by us with our own research code. They are not part of the app. M Alpha Core has one built-in strategy: its scan finds the best settings of that strategy for your market and then checks them on months the search never saw. The lesson from this video is the same one the app is built on: judge a strategy by the full record of trades after fees, not by a headline number.
More on this topic: Out of sample testing explained.
October 26, 2026 · 0:41
The 70 % MACD and Parabolic SAR strategy on 6 coins, 2021 to 2026: 11,466 trades, a 50 % win rate and a loss after fees in every year.
October 26, 2026 · 0:33
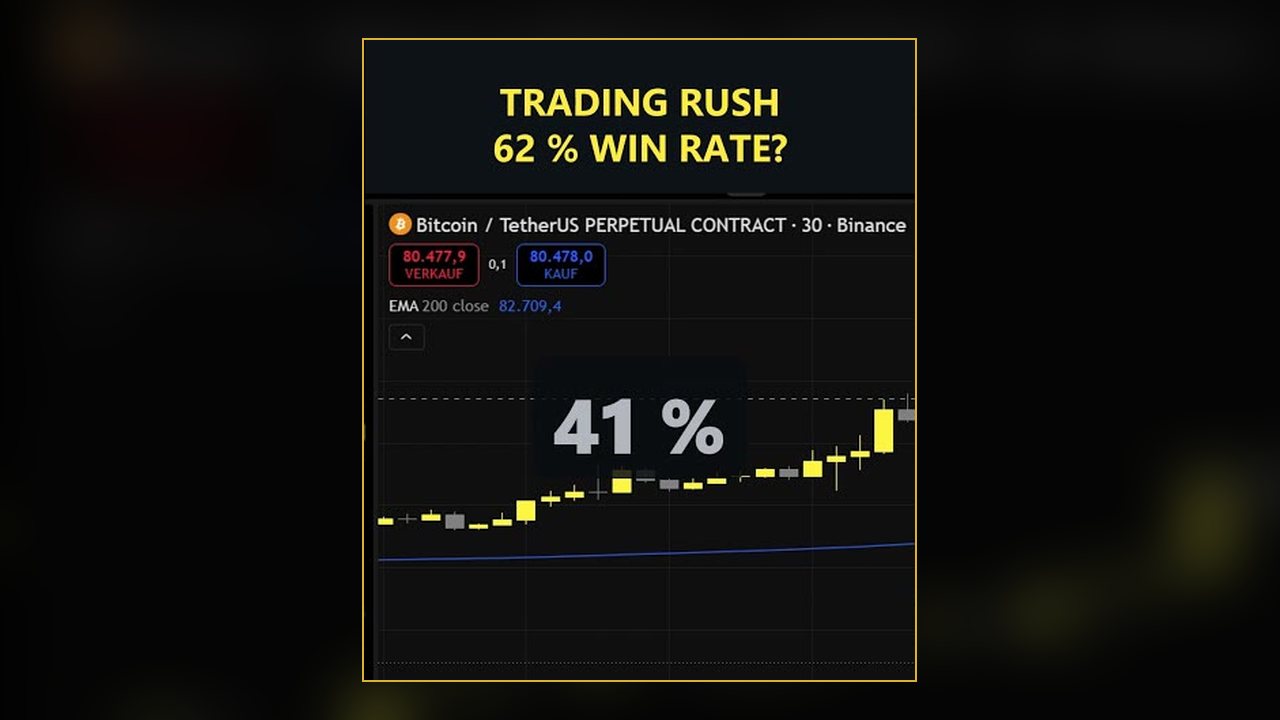
Trading Rush's MACD and 200 EMA rules on 6 coins over 6 years with real fees: over 6,000 trades and a small loss.
October 26, 2026 · 0:32
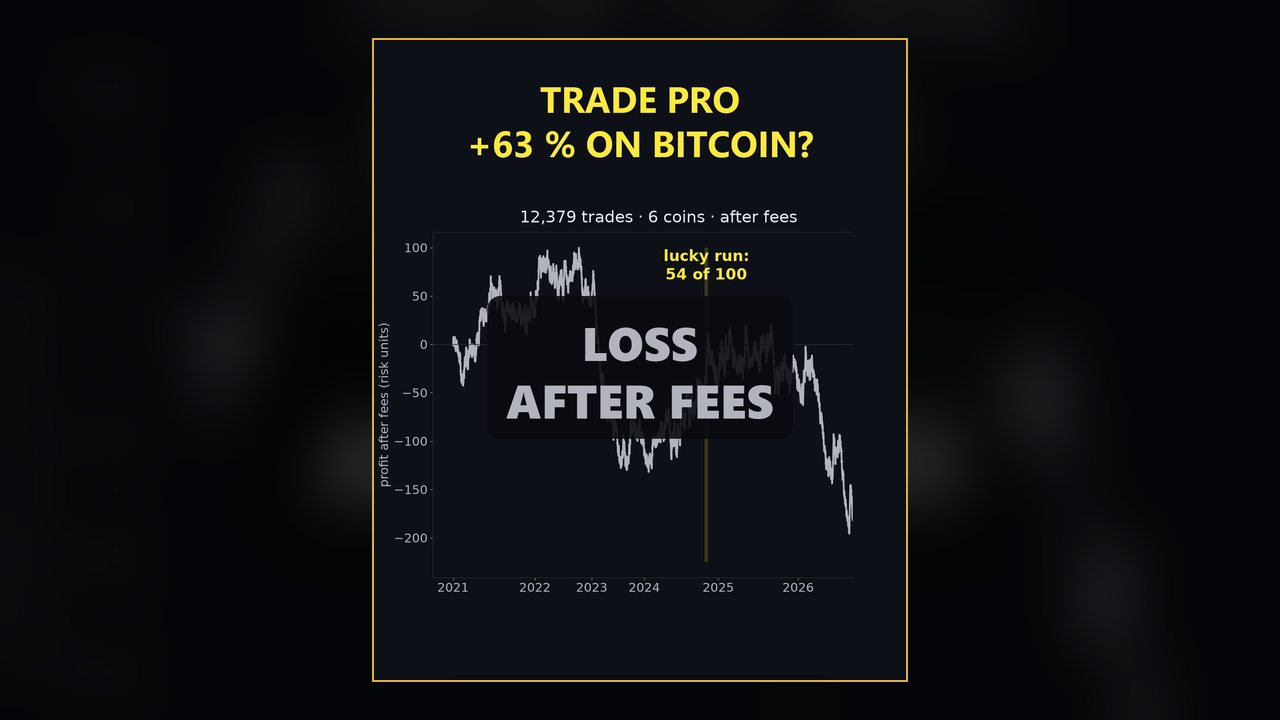
Heikin Ashi with Parabolic SAR and the 200 EMA: +63 % on Bitcoin in the original, a loss after fees across 12,379 trades in our test.
October 27, 2026 · 0:59
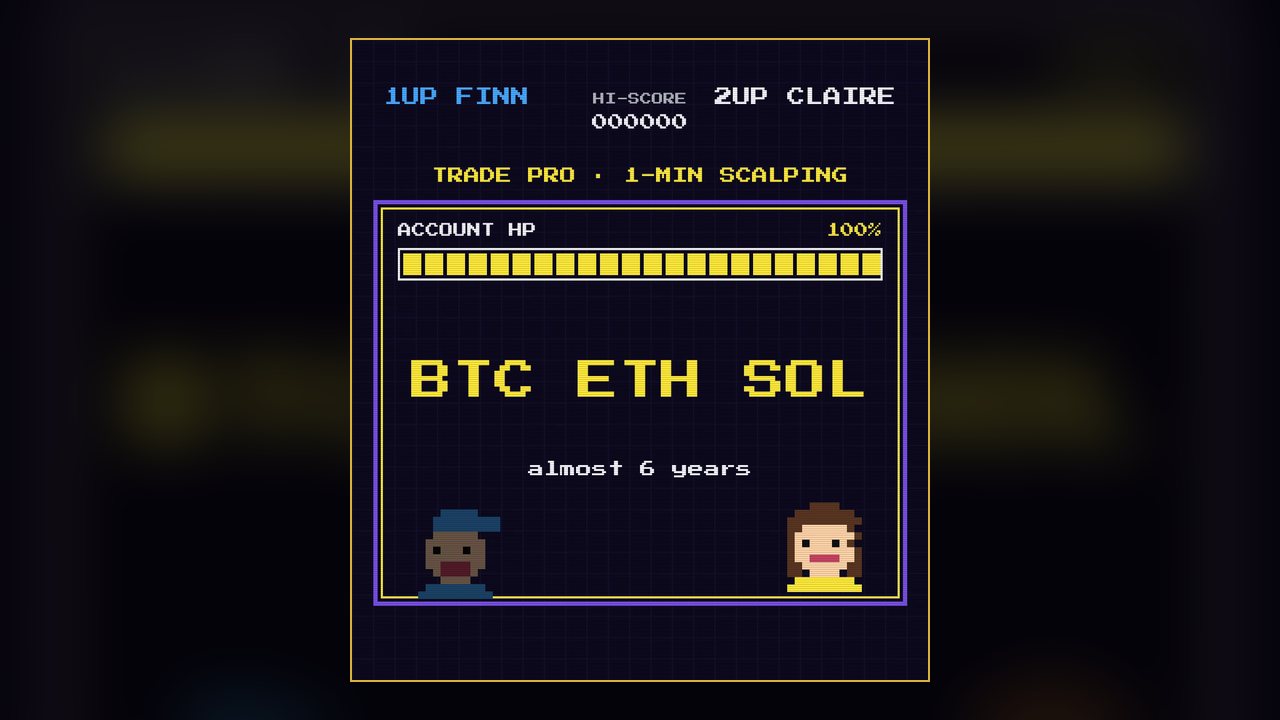
Trade Pro's 1 minute scalping: a tiny profit before fees on 197,140 trades, but fees ate about 80 % of the risk. Profit factor 0.30.
All figures come from backtests on past market data. No result is a promise of future profit. Trading, especially with leverage, involves high risk. M Alpha Core is a software tool, not investment advice.